Device Management and Performance Monitoring
Onboarding of new devices made easy
Before you send your device to the field configure it to enable communication with Orchestra.
Follow the How to add a Device user guide. Also accessible from the platform under Add button.
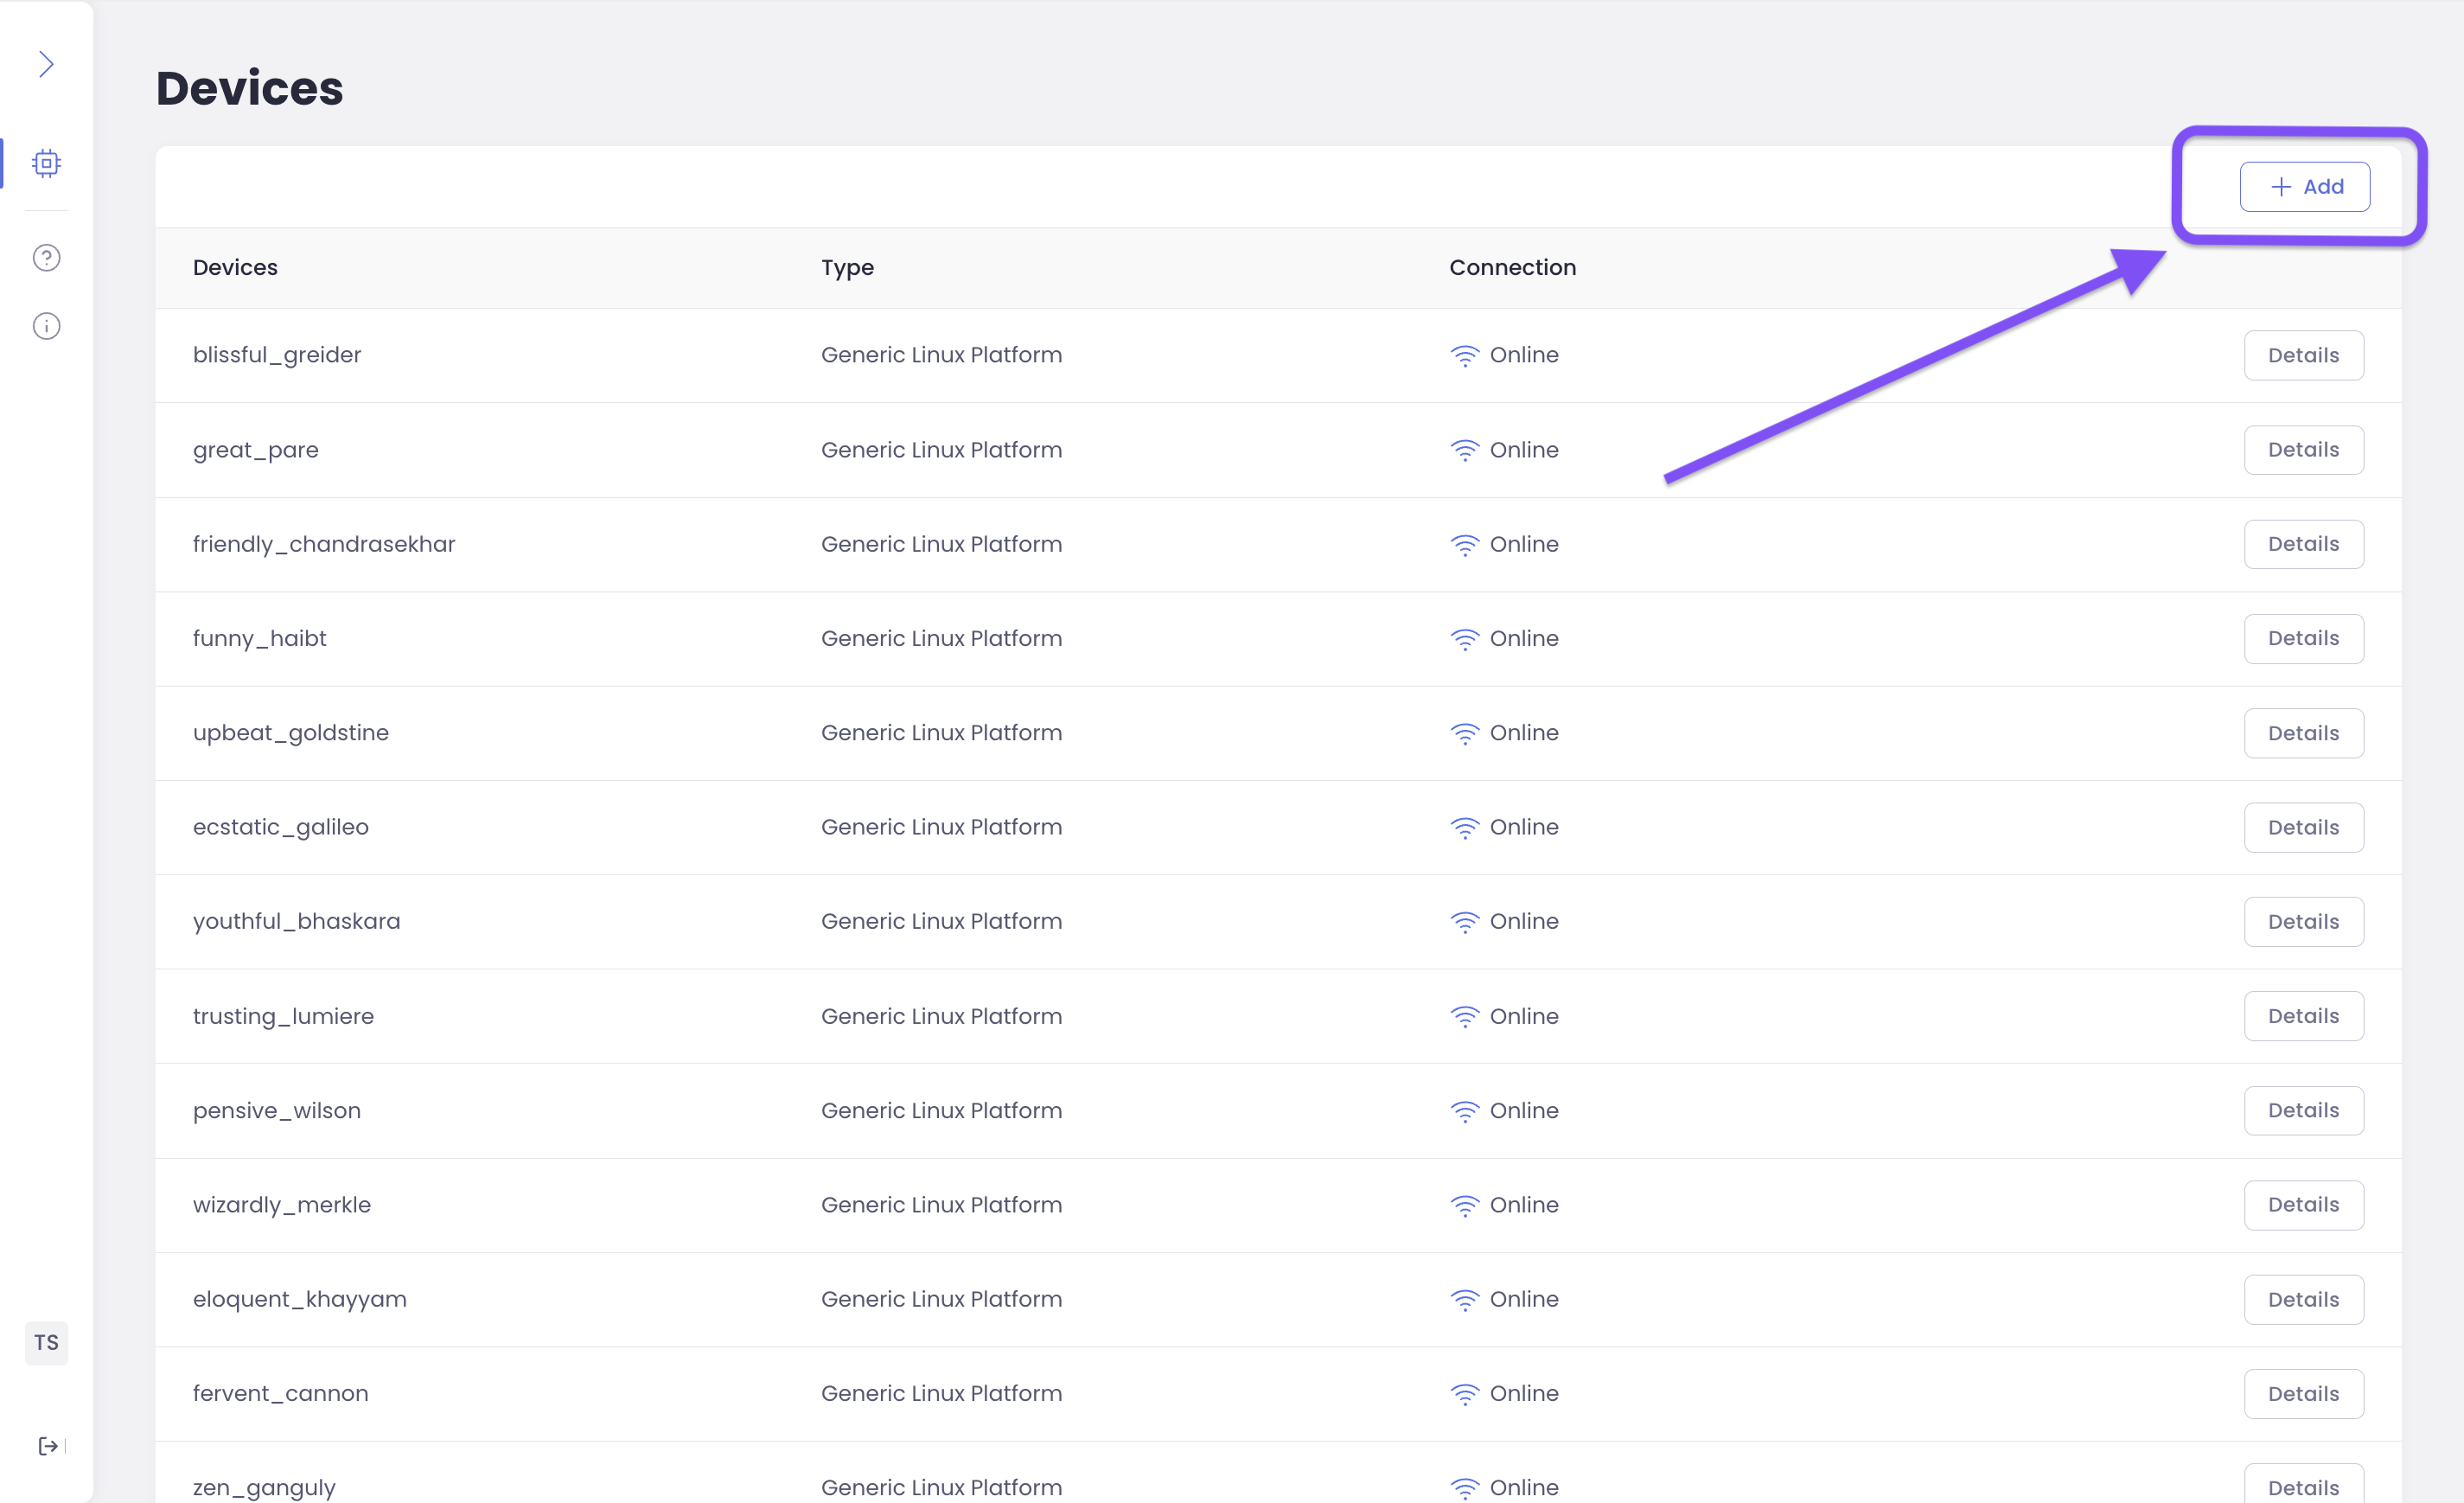
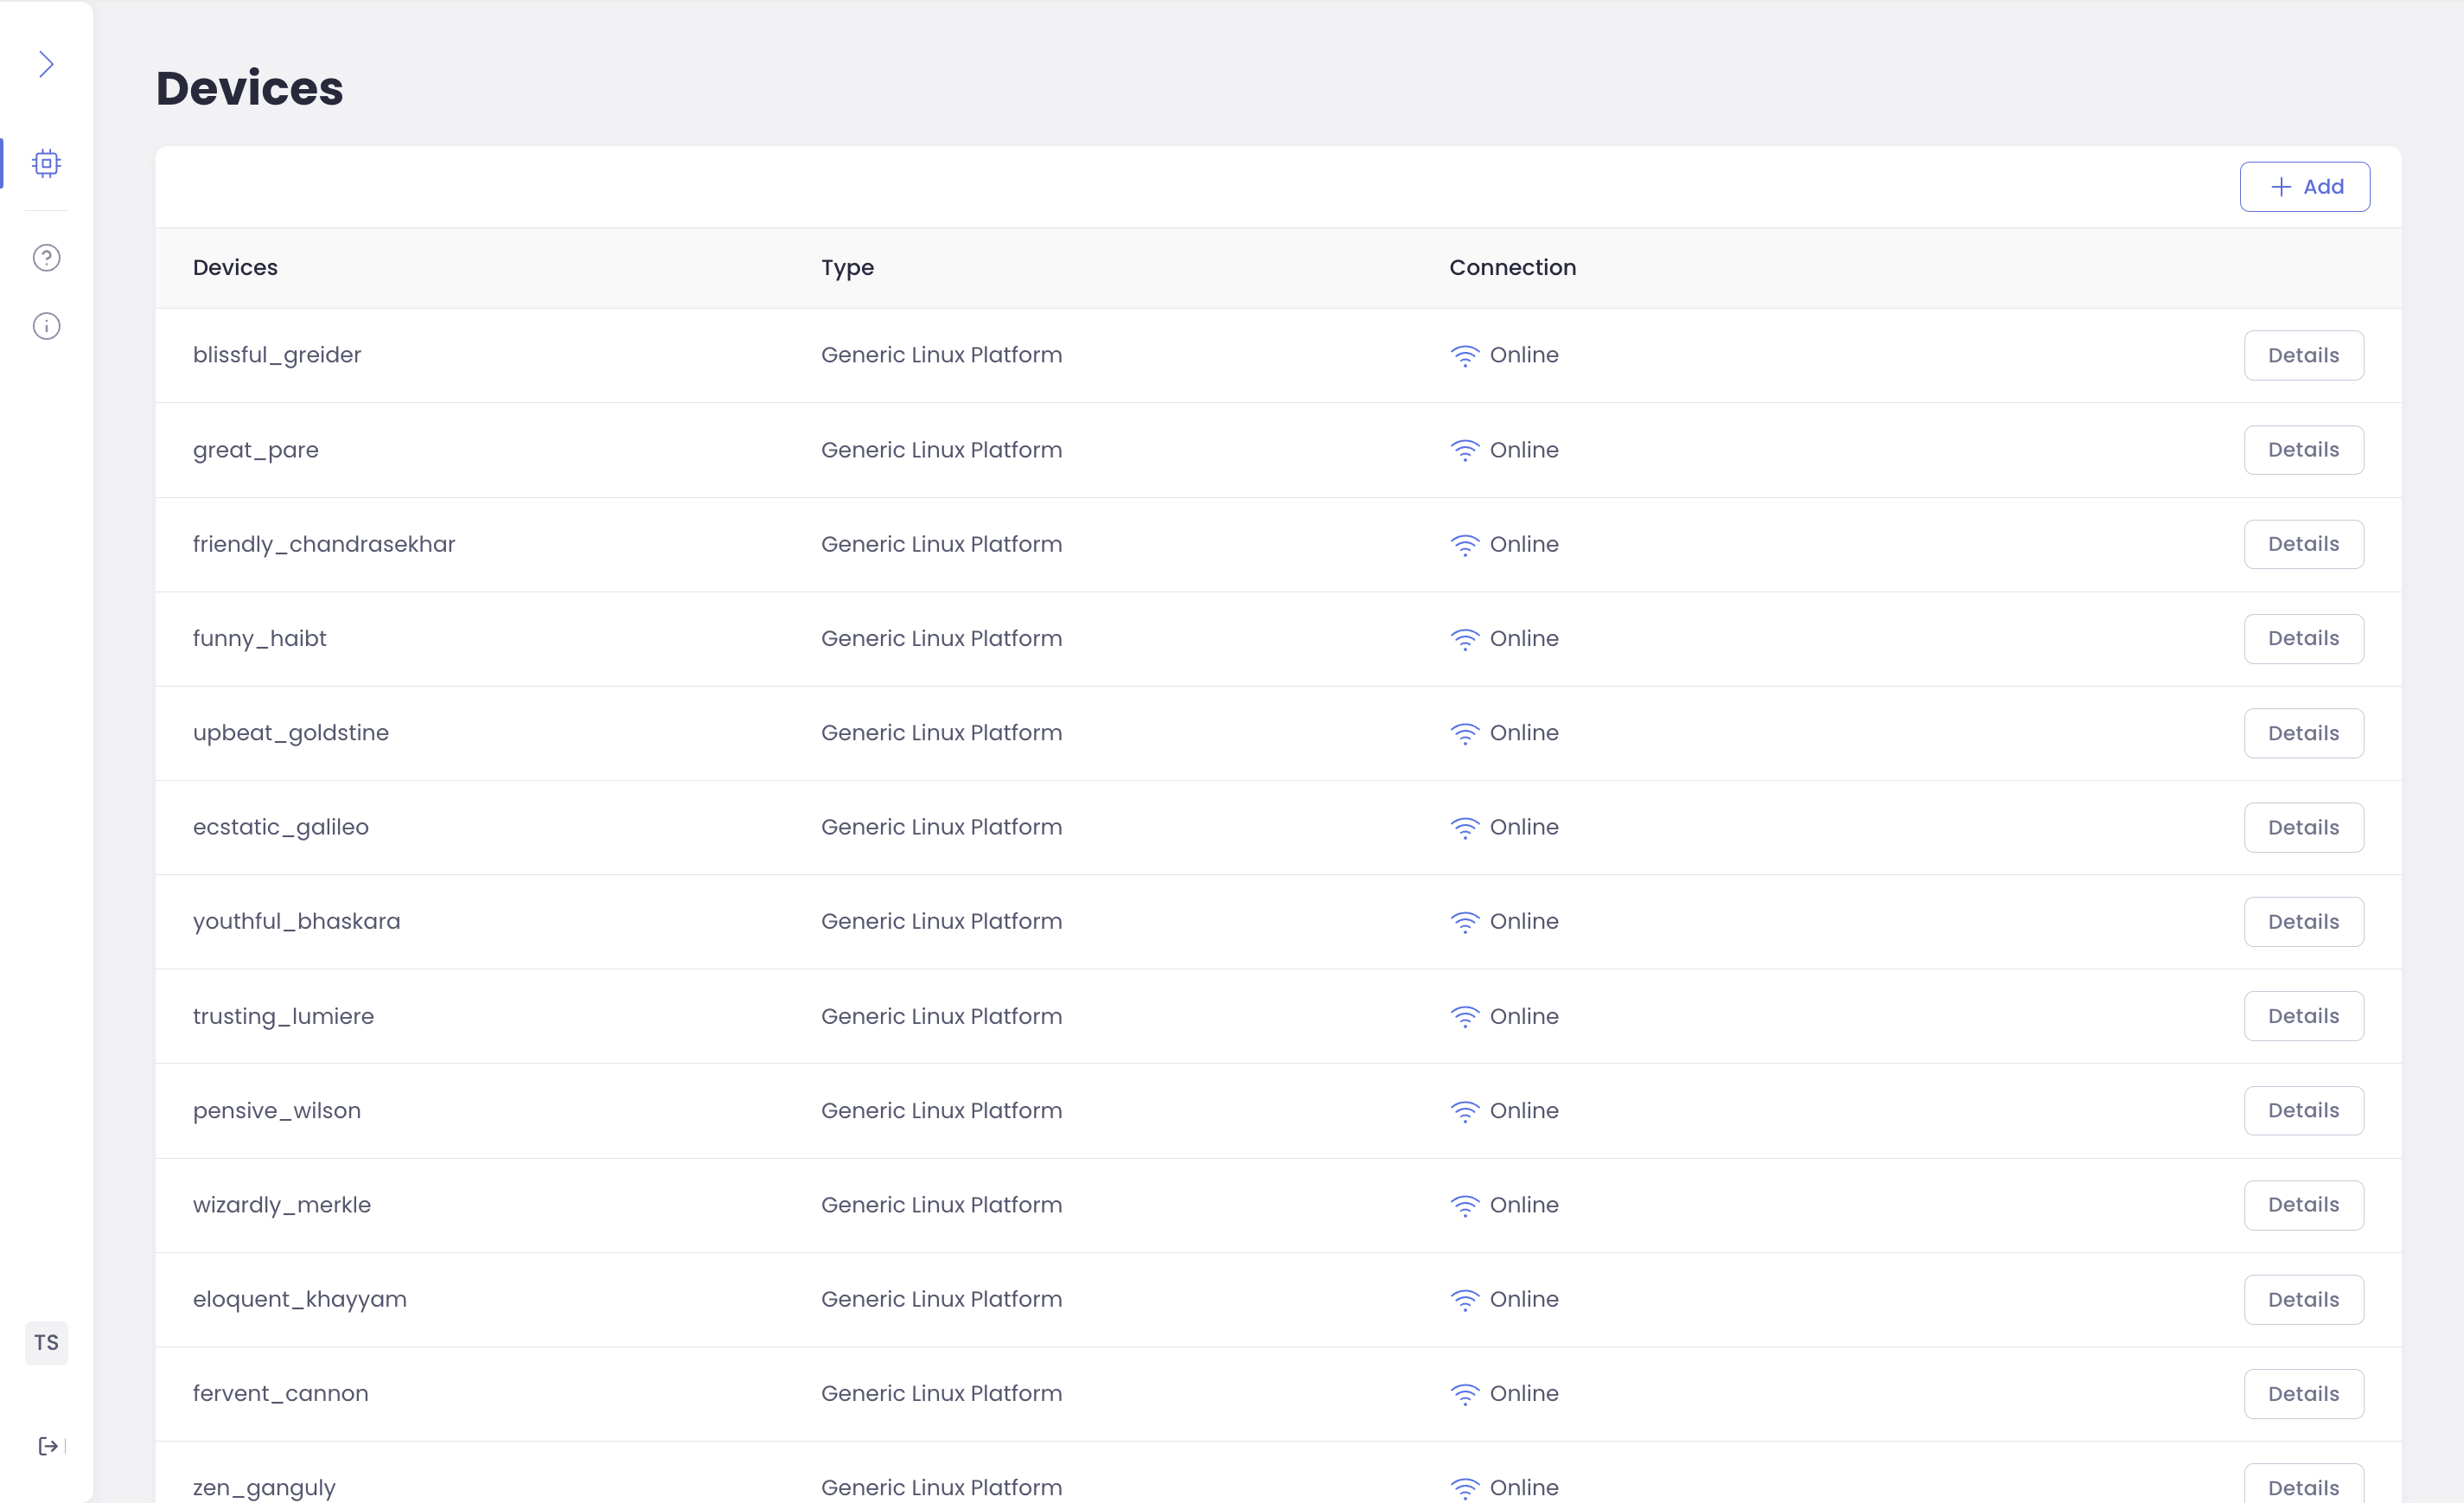
Devices
The Devices page lists all of your devices added to Orchestra. From here, users can navigate to each device to see details, monitor, or connect.
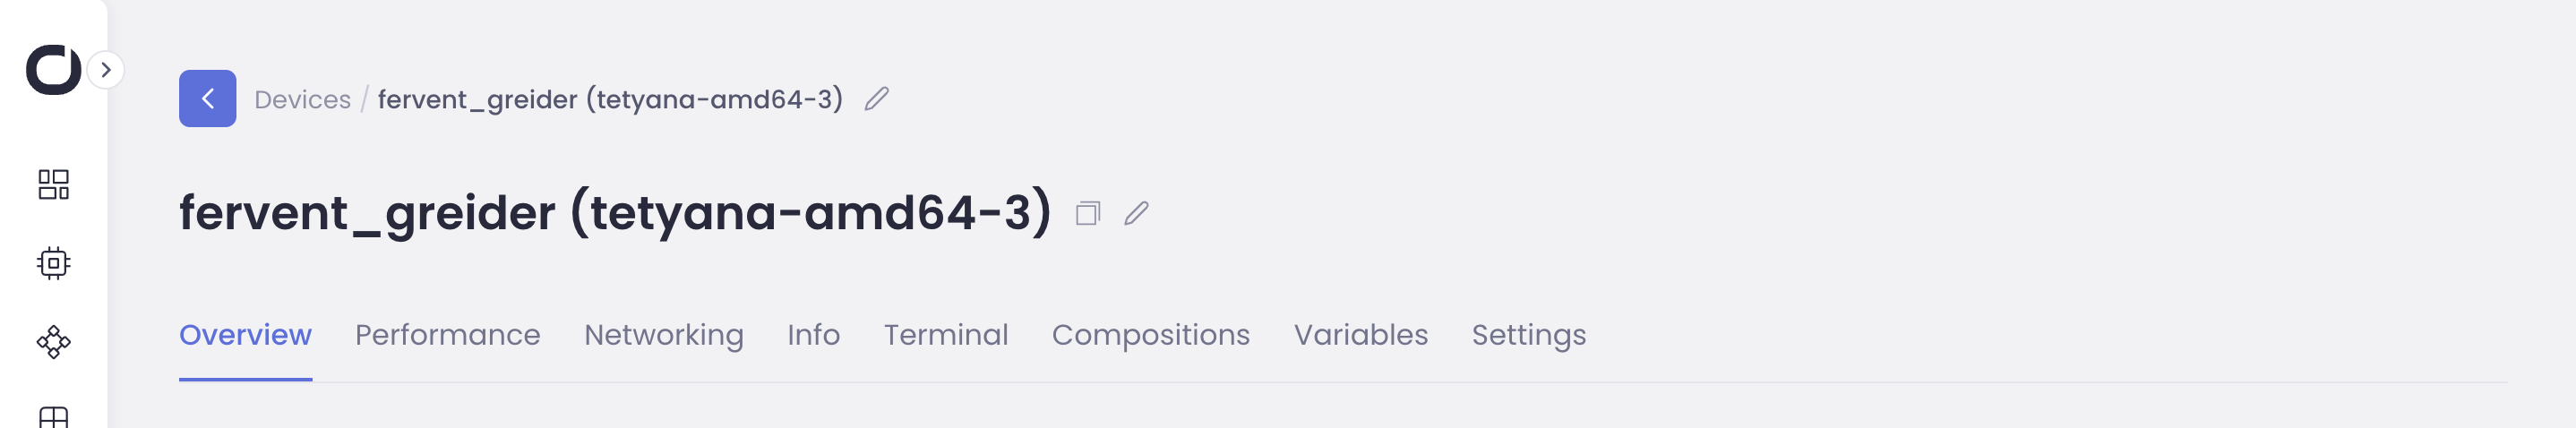
Device insight
The device insight page is divided into six separate tabs to organize information and actions:
Overview
Performance
Networking
Network events (if applicable)
Info
Terminal
Compositions (if applicable)
Variables (if applicable)
Settings
Tip
To learn about Compositions and Variables refer to Containerized Application Lifecycle Management.
Overview
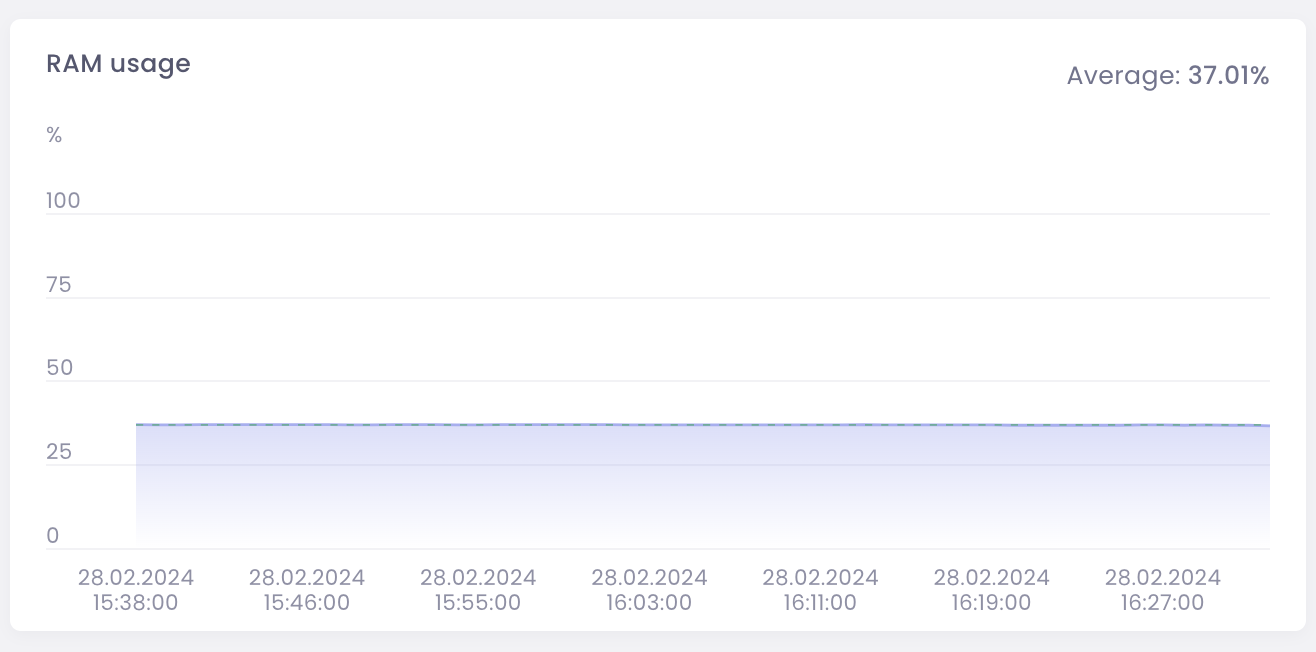
The overview tab provides quick-glance information to identify the device and quickly check the basic performance metrics.
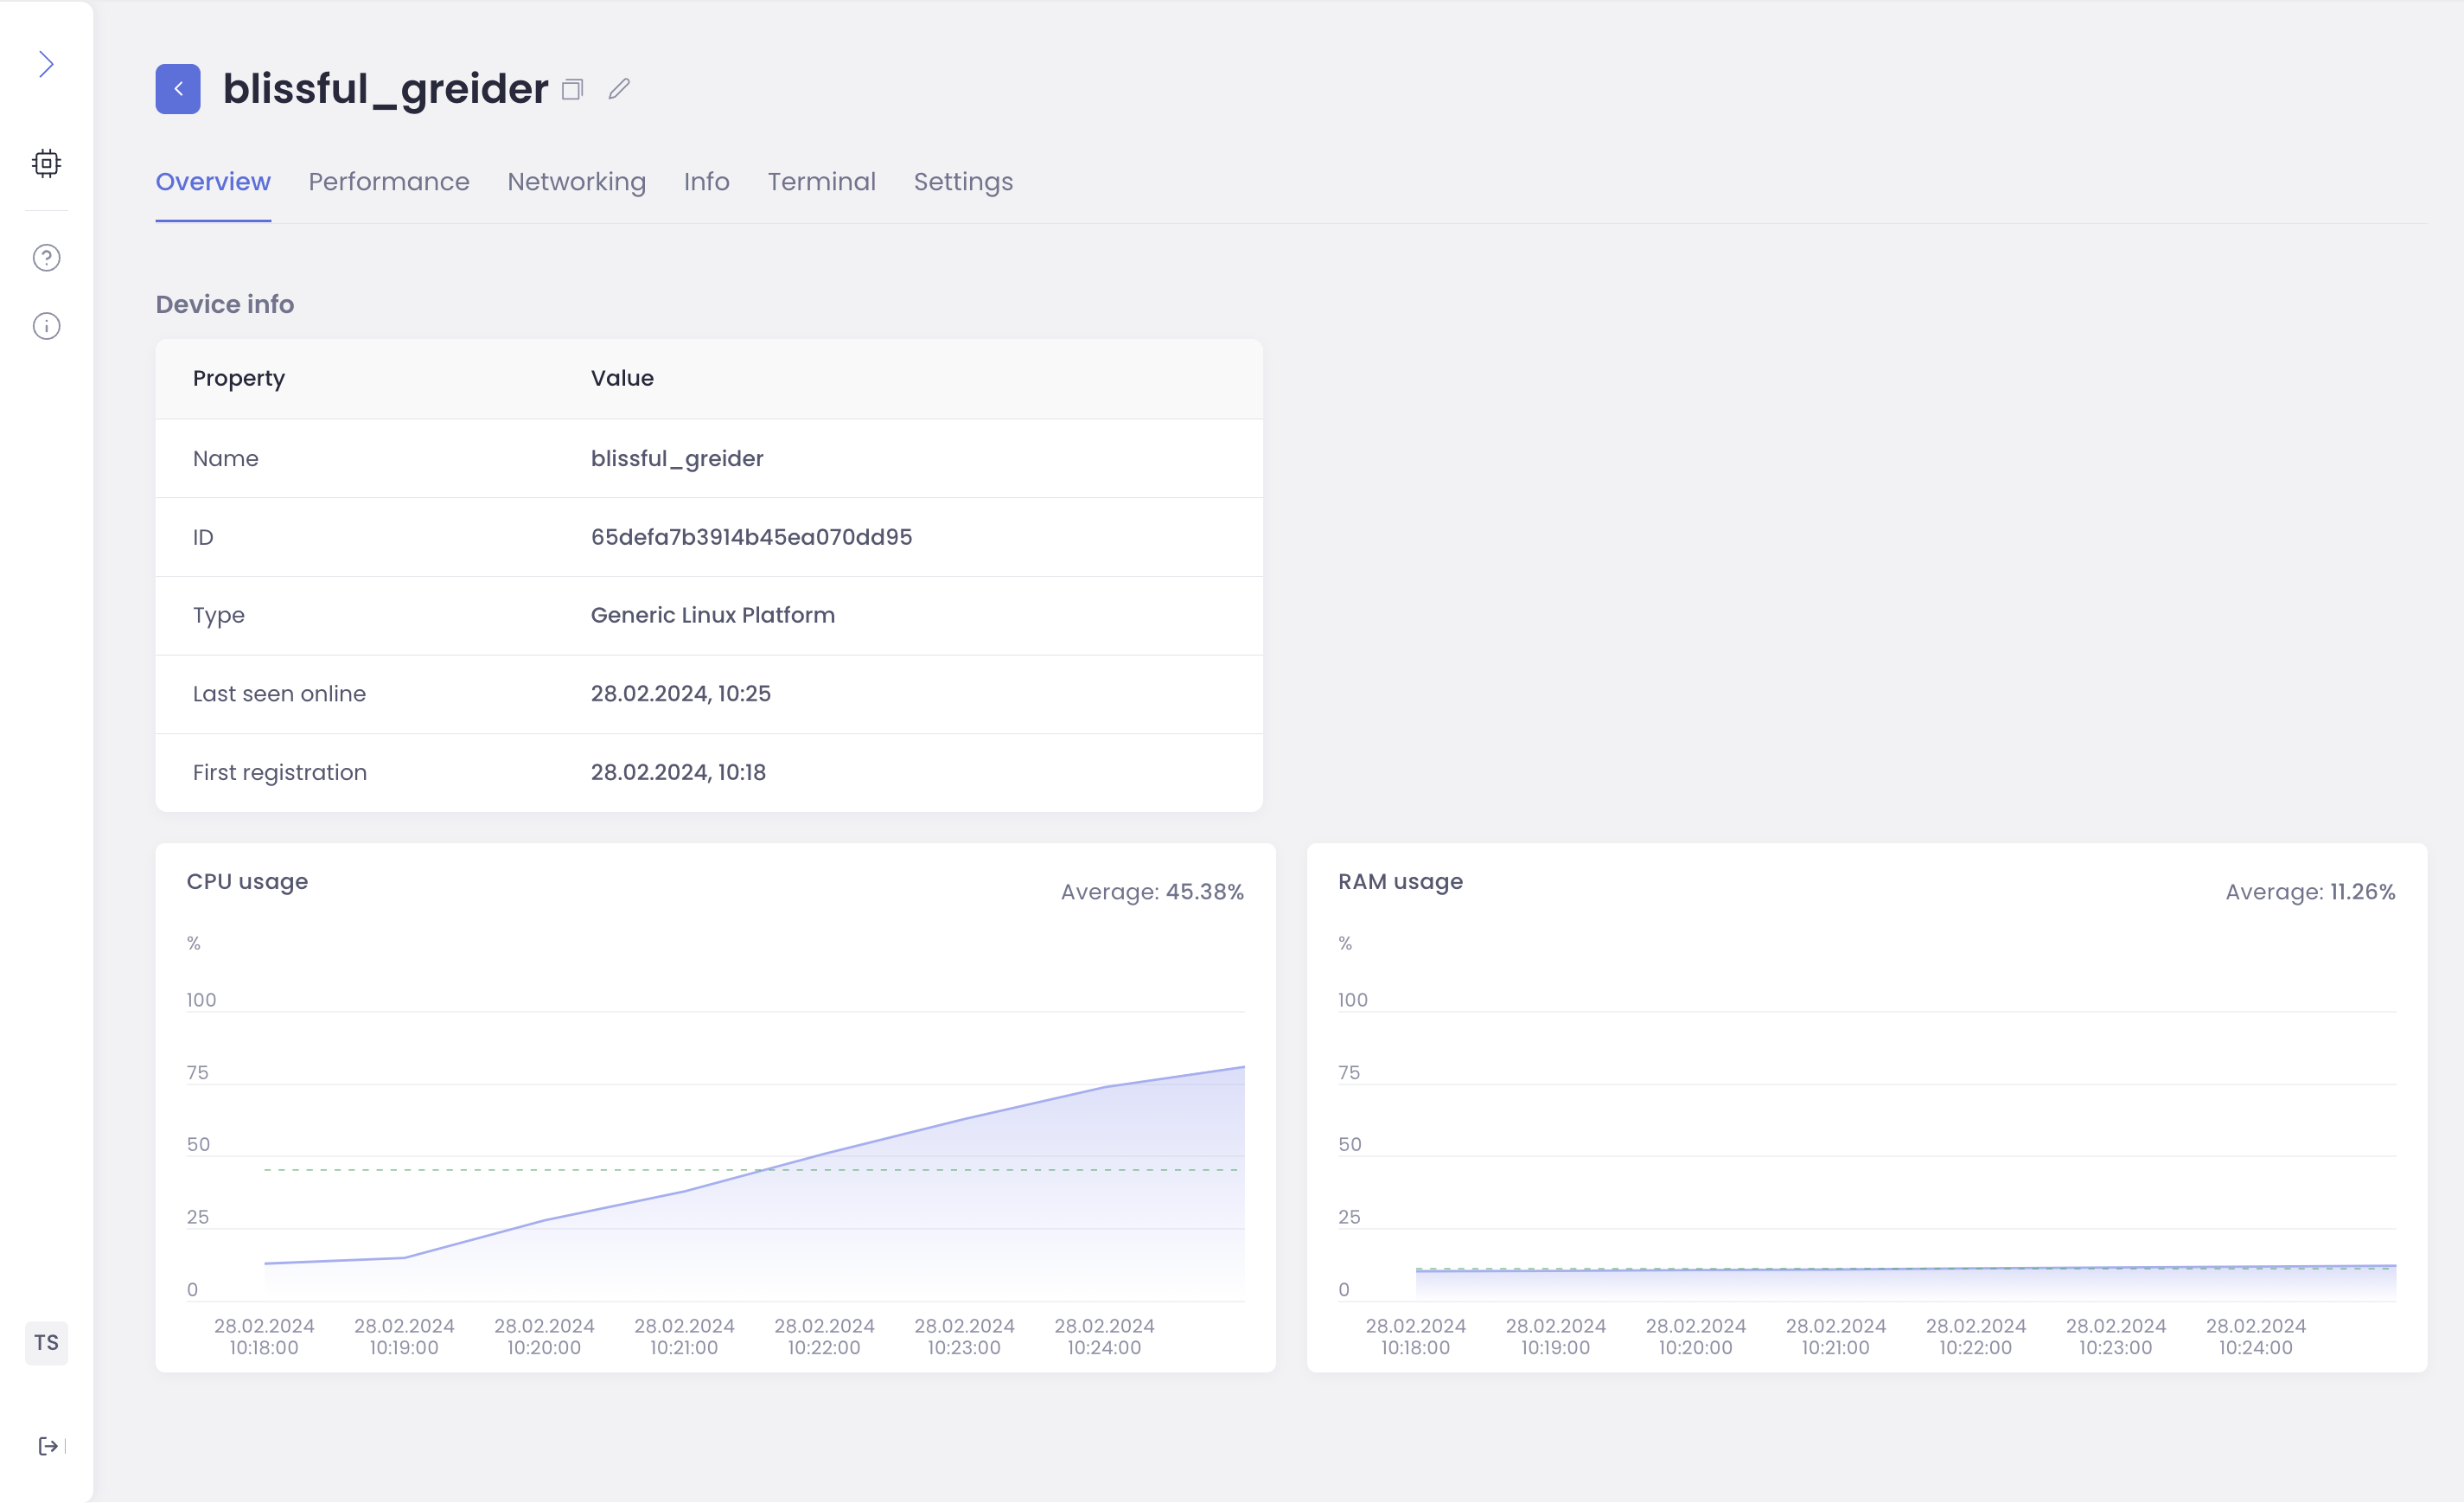
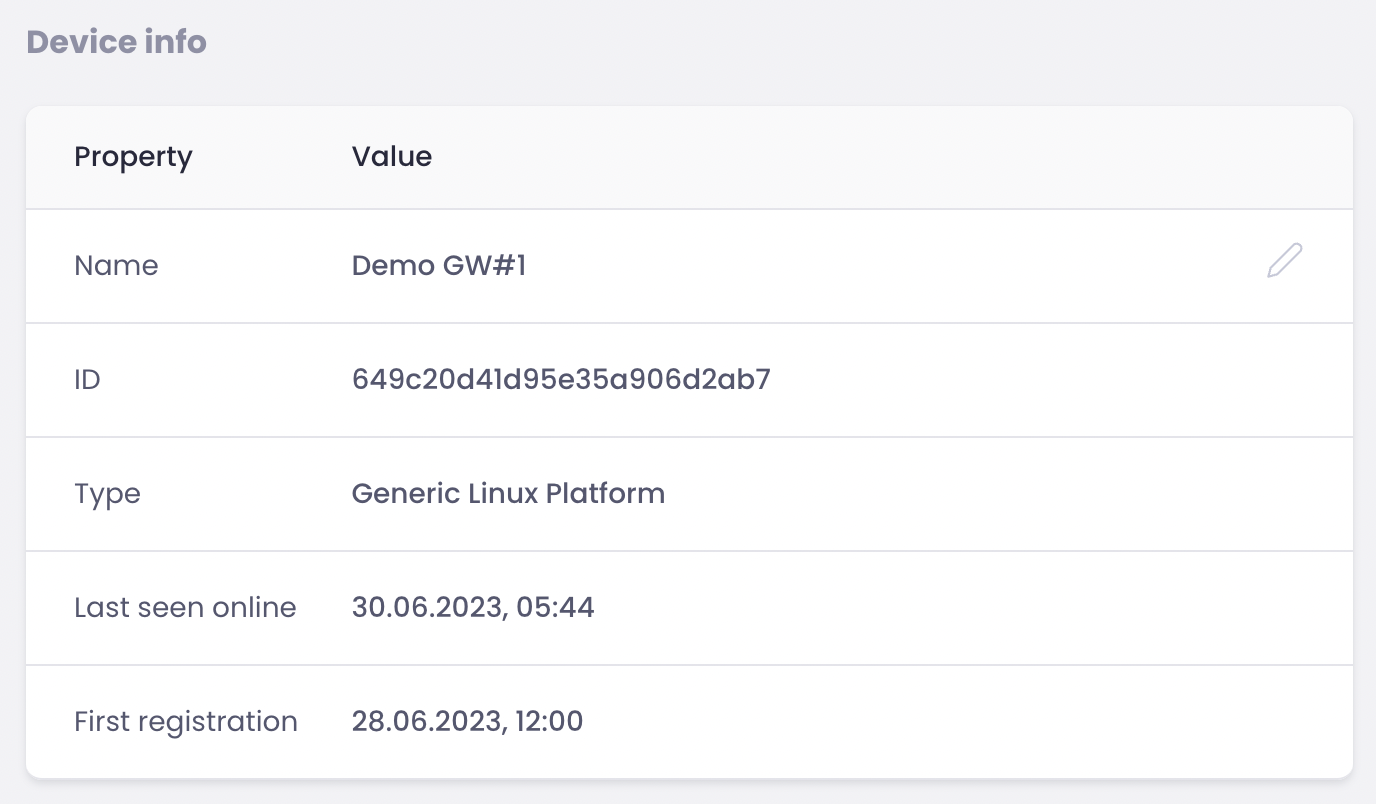
The device info table has:
Name - the human-readable name that can be changed for easier identification by the user;
ID
Type
Last seen online
First Registration
Below are two performance metric graphs:
- CPU usage, and
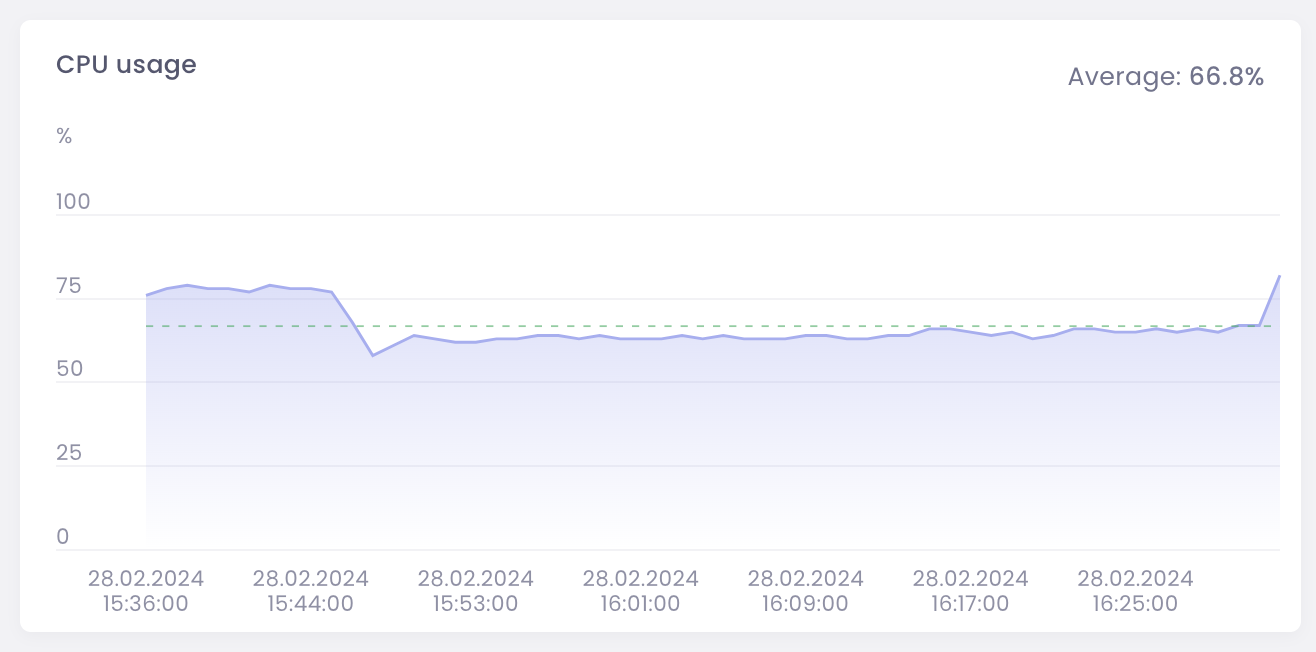
- RAM usage
Now, let’s look at the next tab.
Performance
The performance tab gives a deeper view of metrics. Displaying graphs of:
CPU usage
RAM usage
Disk operations (operations per second)
Network (incoming)
Network (outgoing)
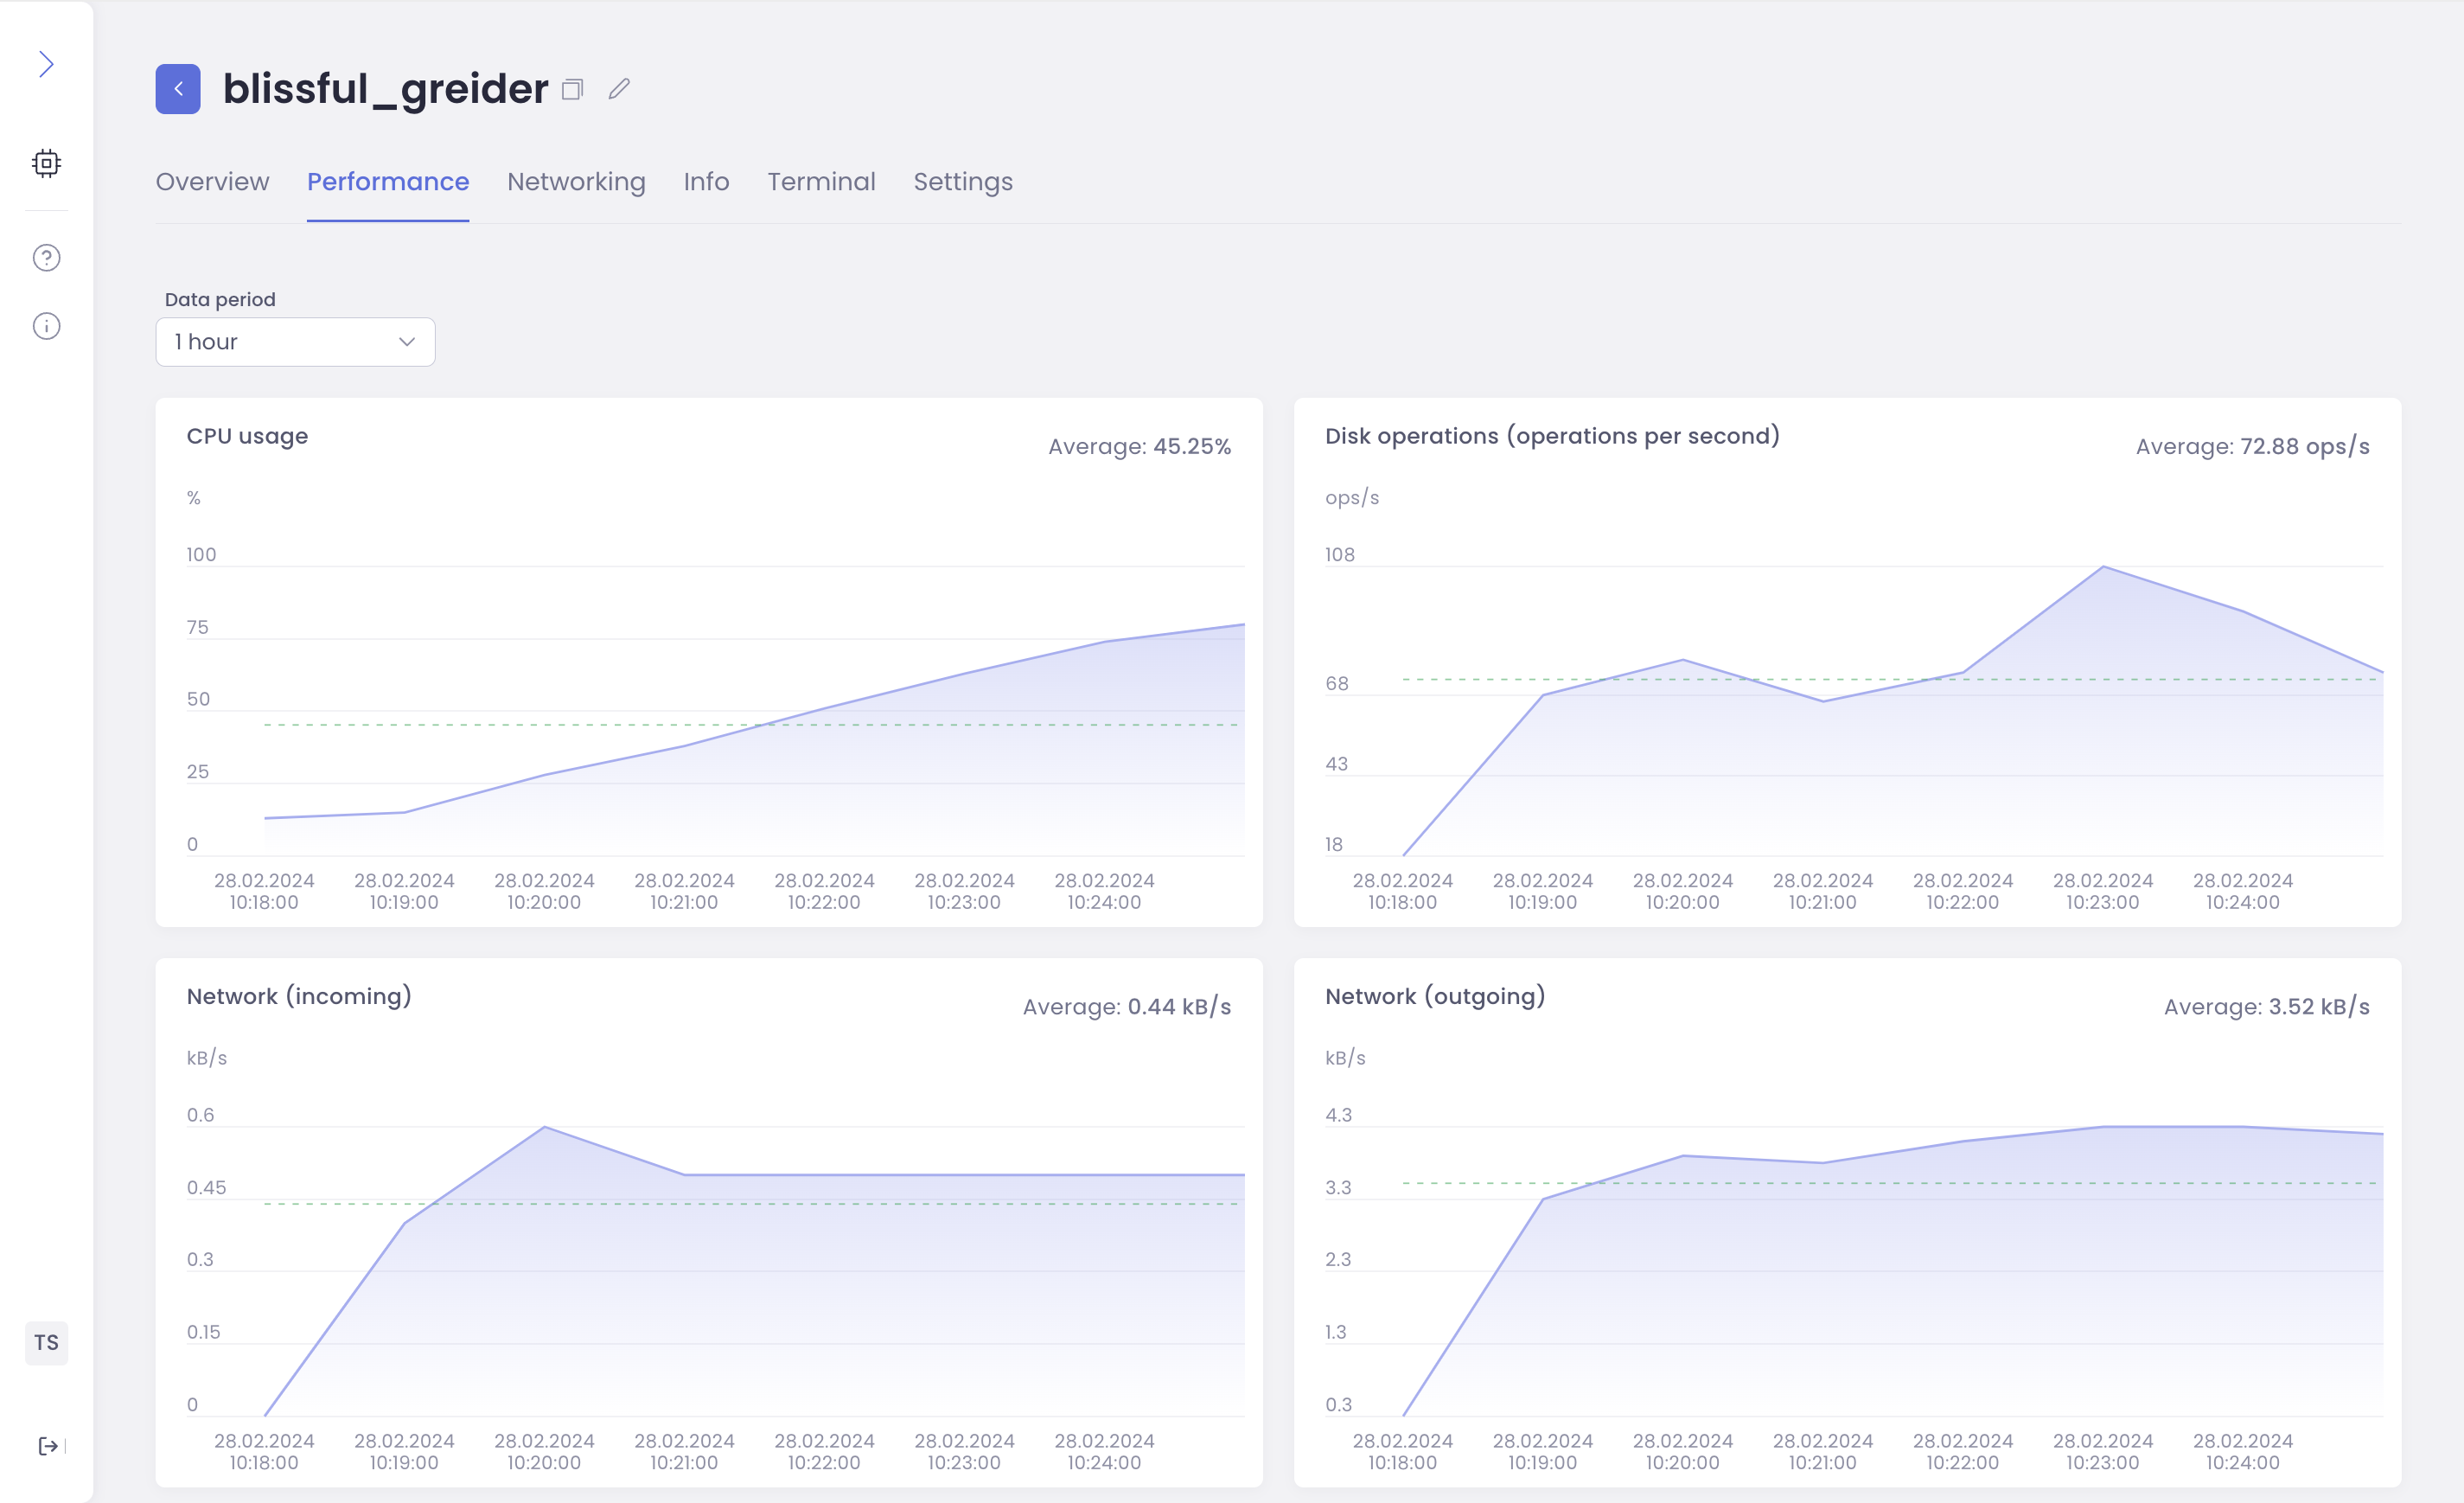
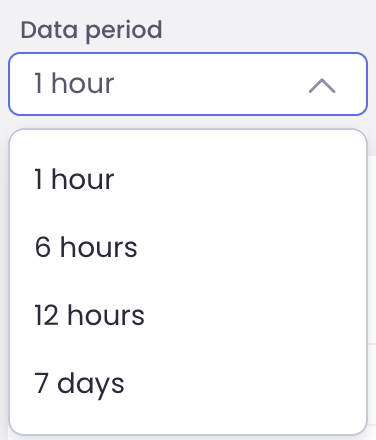
Users can select the data period to see data from:
1 hour
6 hours
12 hours
7 days
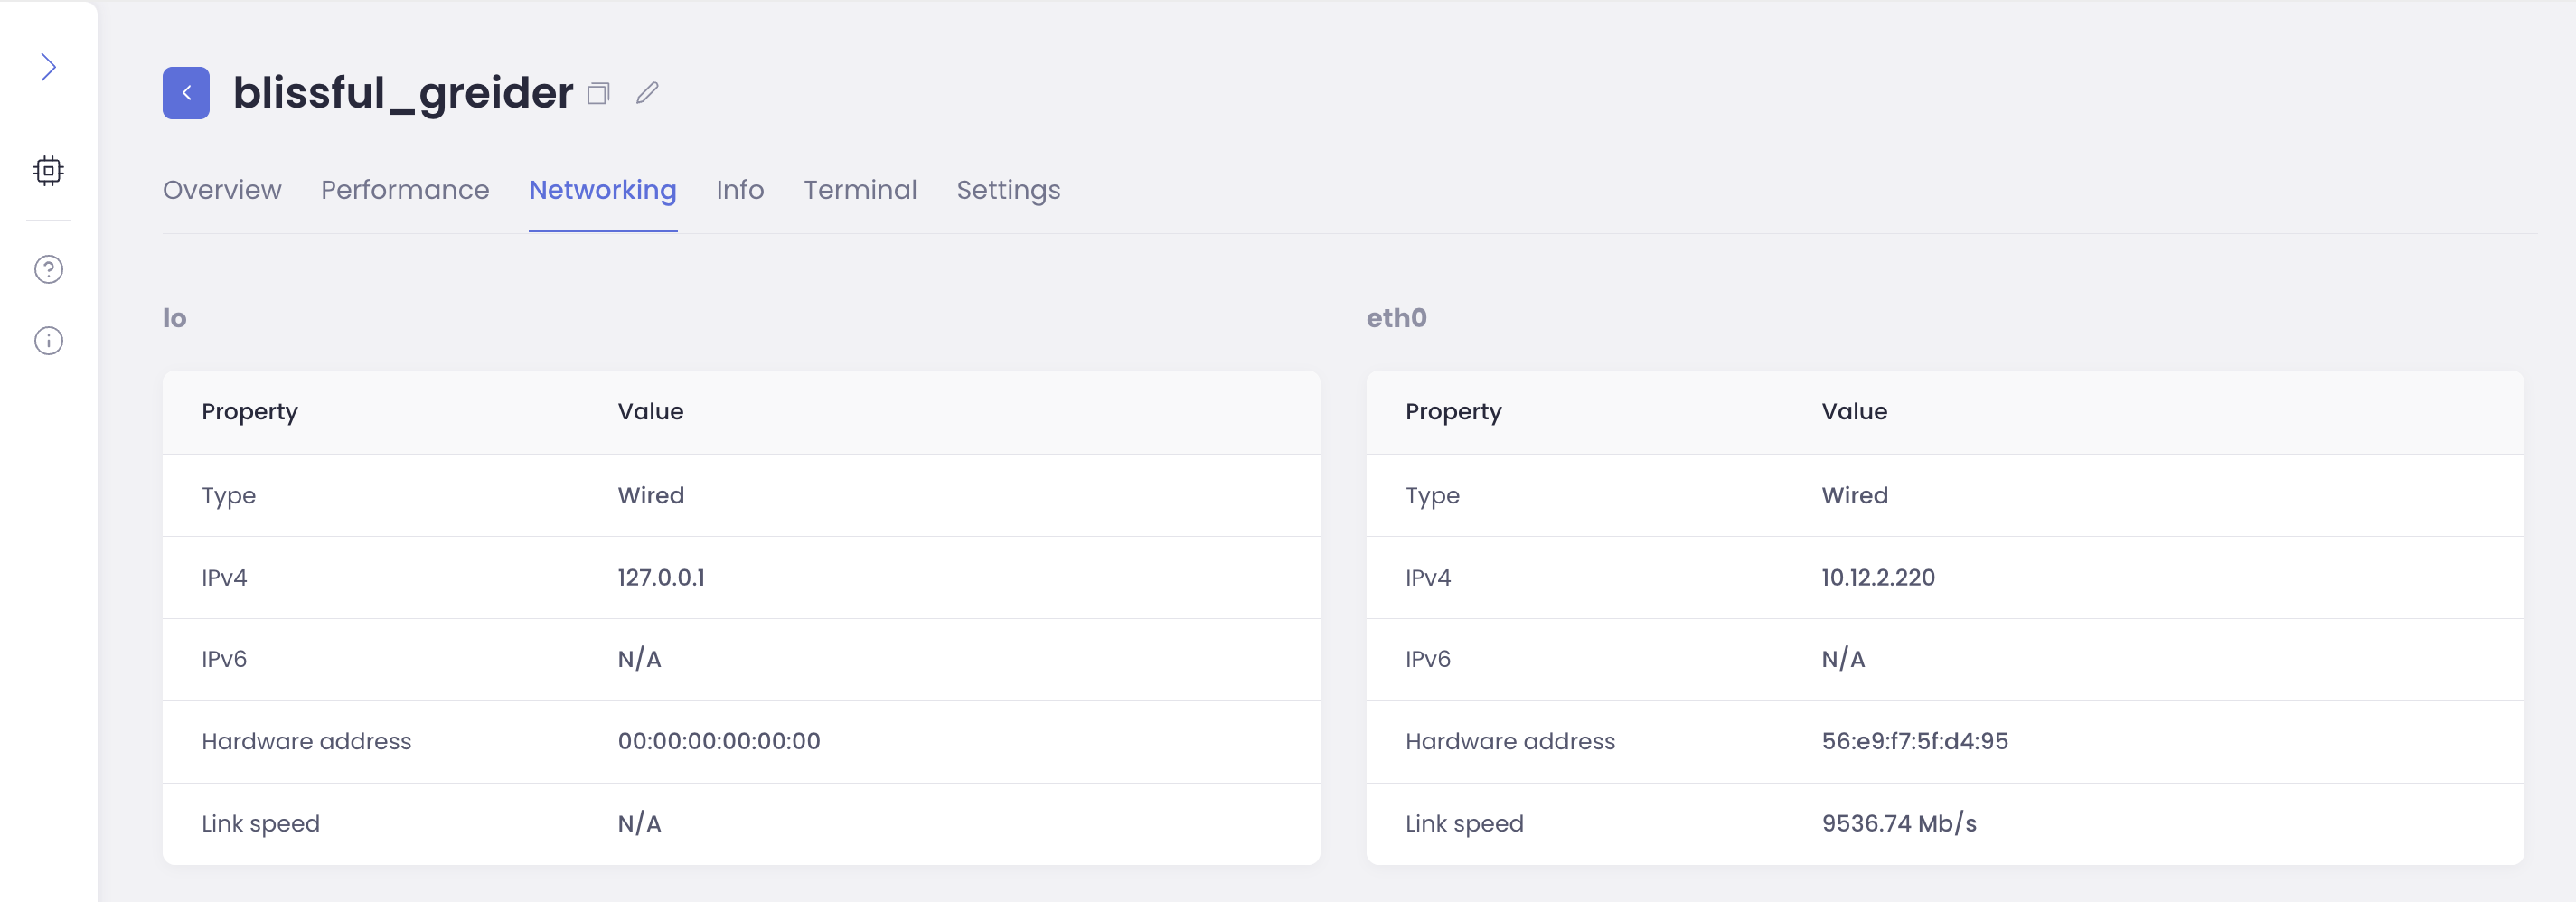
Networking
The networking tab summarizes the connections available, providing relevant information for each interface.
Network Events (Cellular Modems)
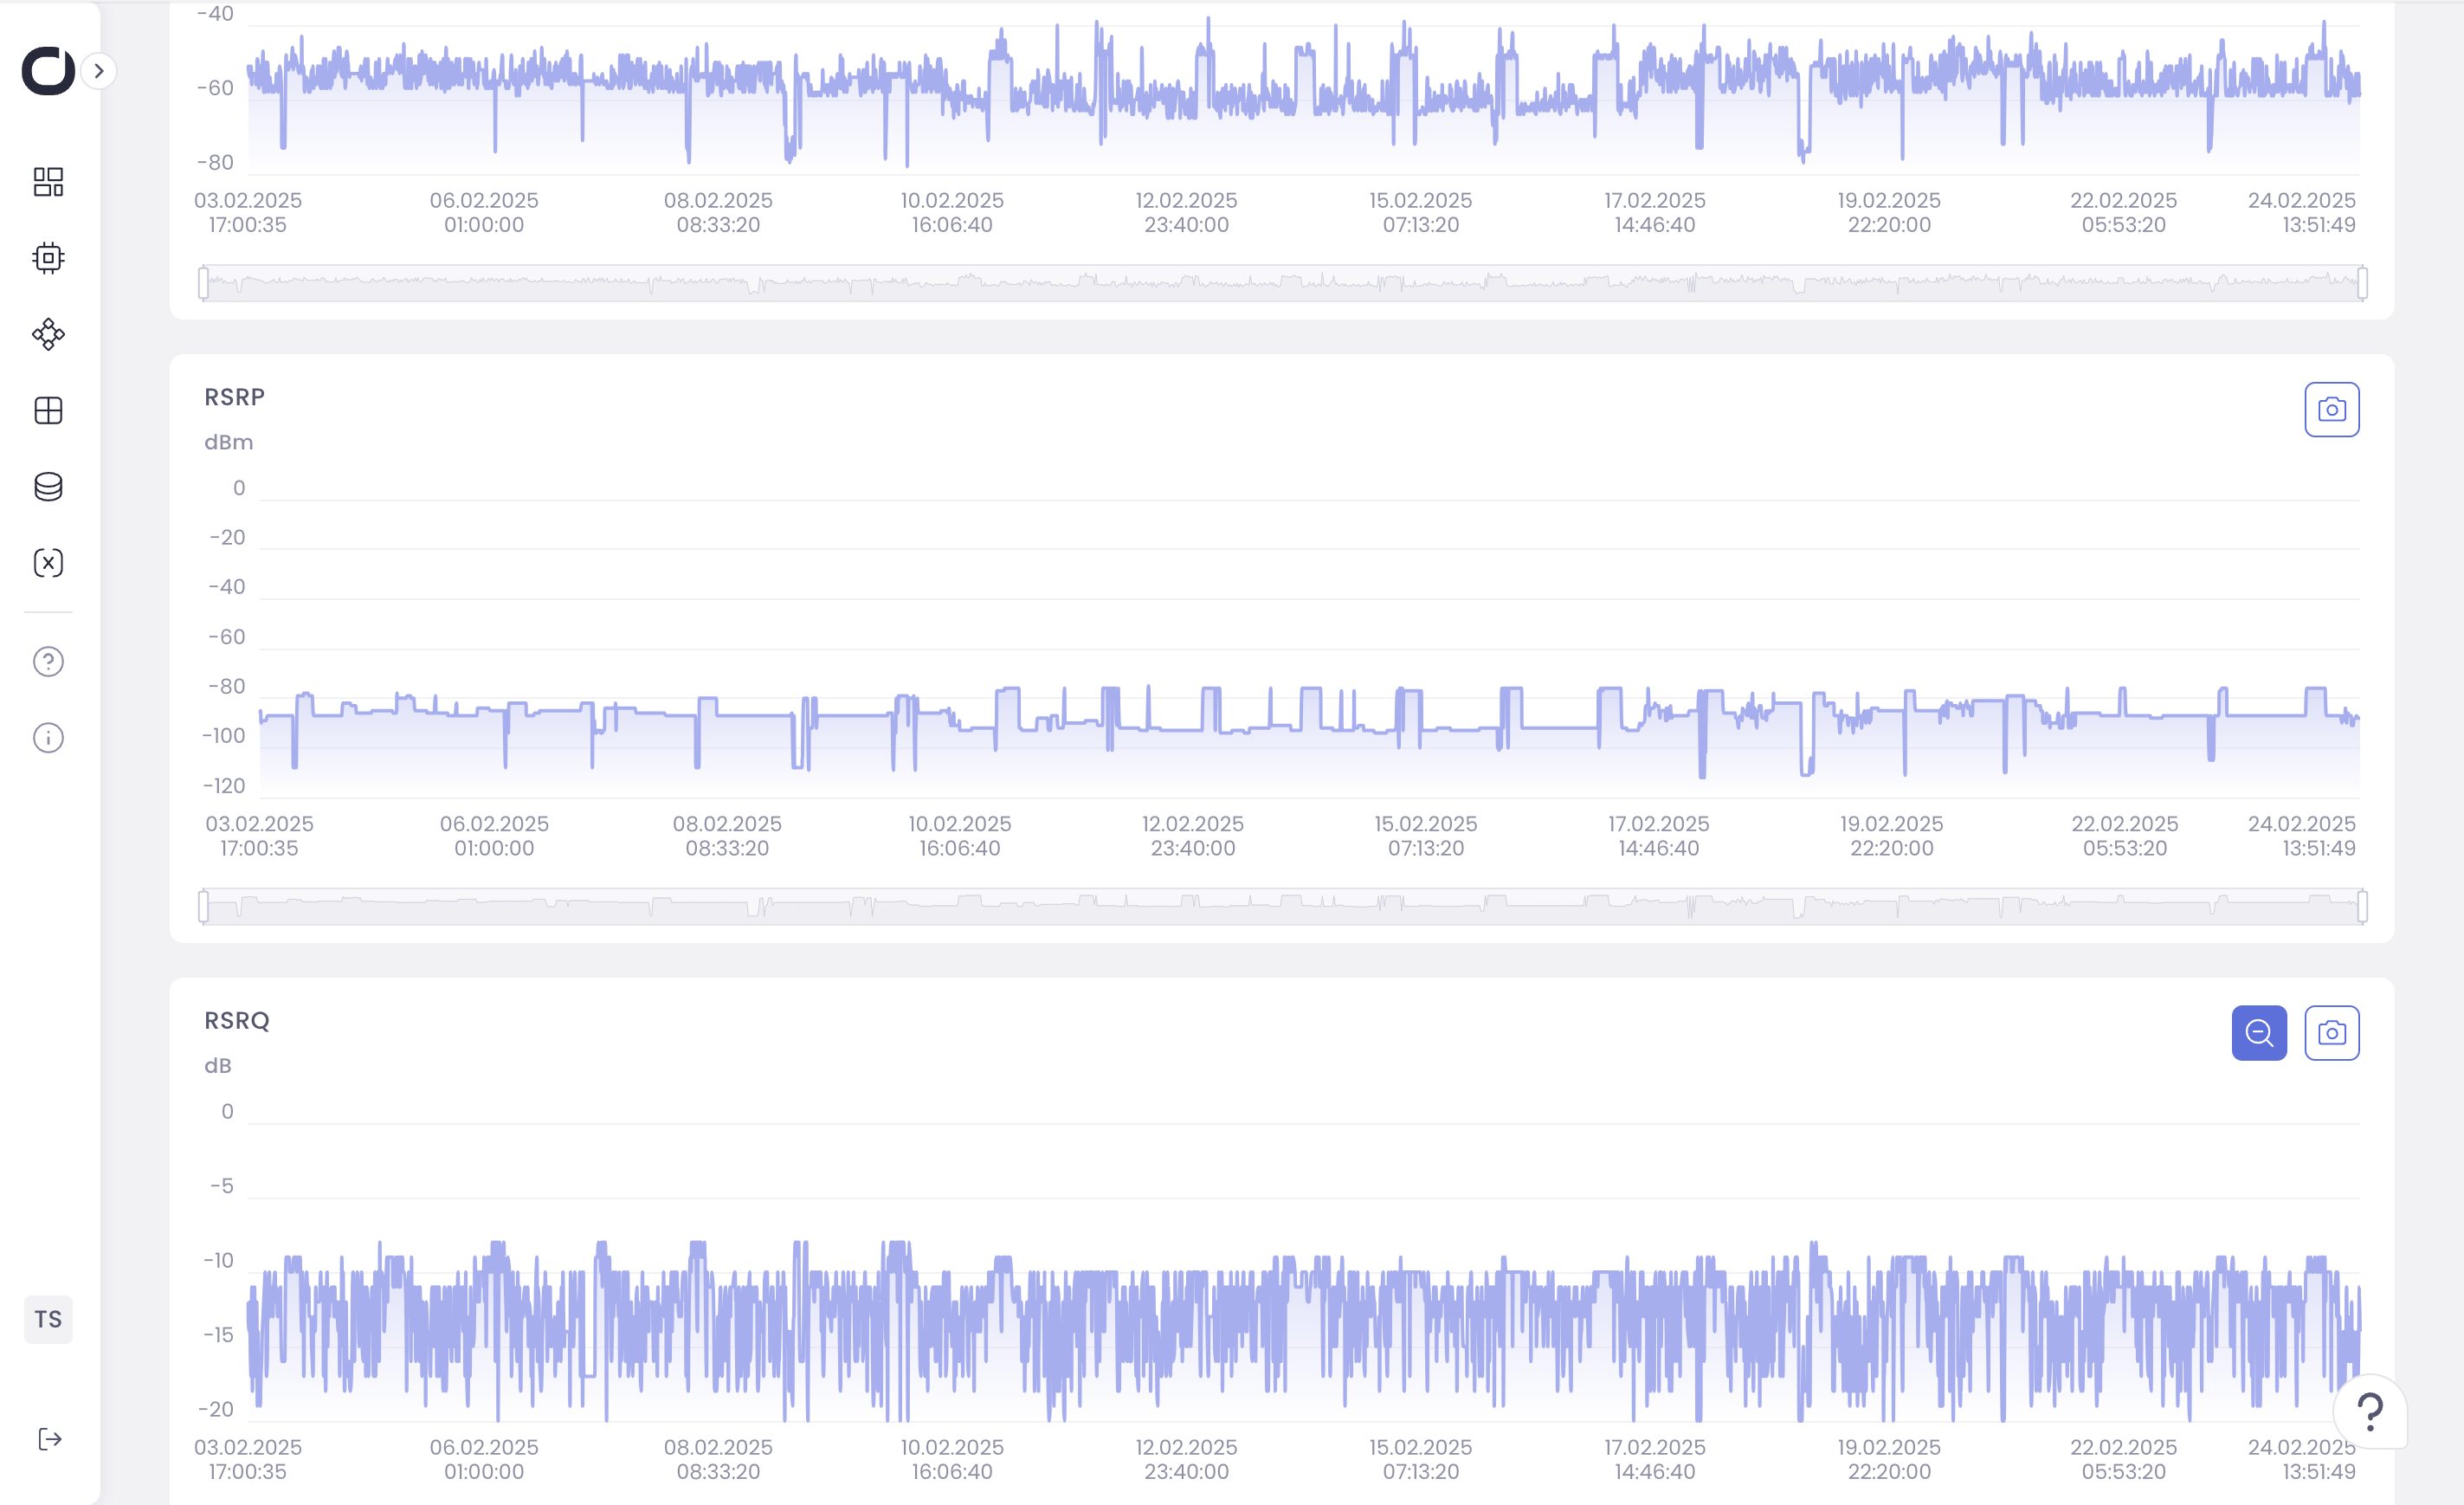
This tab provides detailed network information for devices with cellular modems, including:
Network Status: Connection type (e.g., LTE), signal strength (RSSI, RSRP, RSRQ, SNR), and registration status.
Hardware Details: Manufacturer, model, and IMEI of the networking equipment.
SIM Card Info: ICCID and IMSI.
Real-time Monitoring: Graphical visualization of signal strength metrics over time.
Historical Events: A searchable and paginated table of network events with timestamps and details.
Info
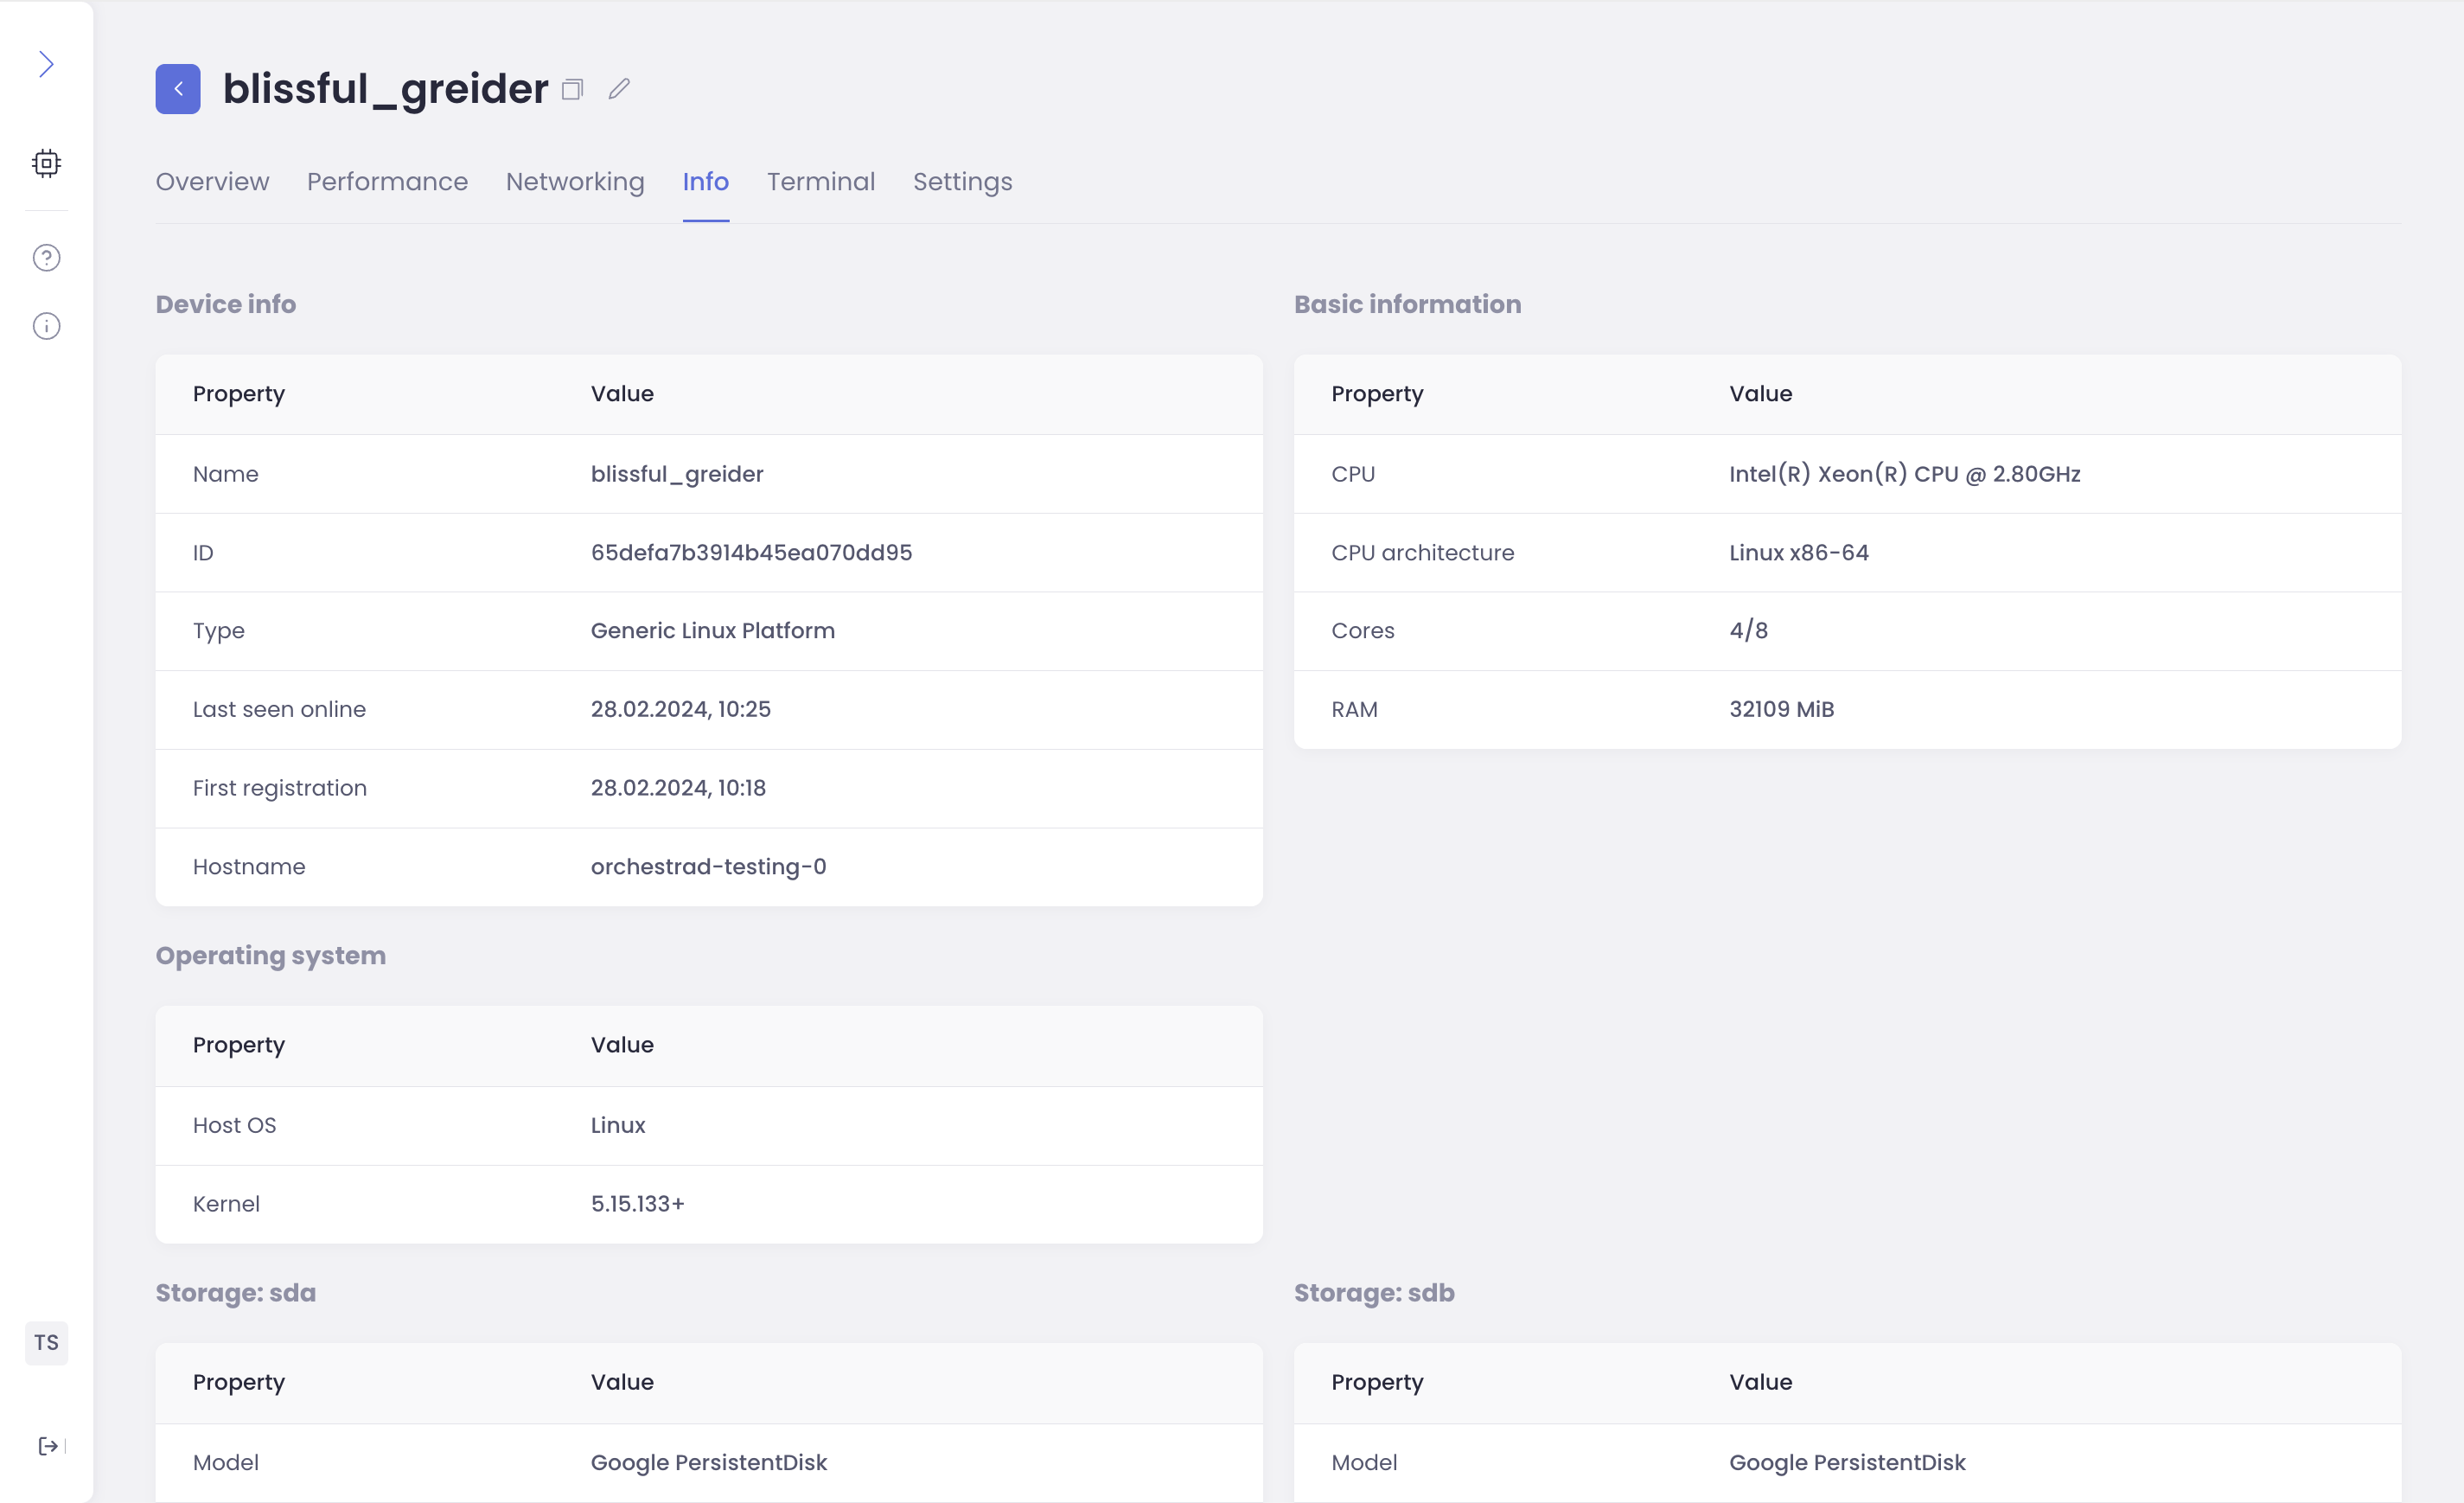
The info tab presents to the user basic static information about the device in four tables:
Device info – contains the same information as in the Overview tab with the addition of the hostname listed;
Basic Information – contains CPU specifications, CPU architecture, numbers of cores and threads, RAM, and operating temperatures;
Storage – lists all storage devices in the system;
Operating System – contains host OS name and has kernel version listed.
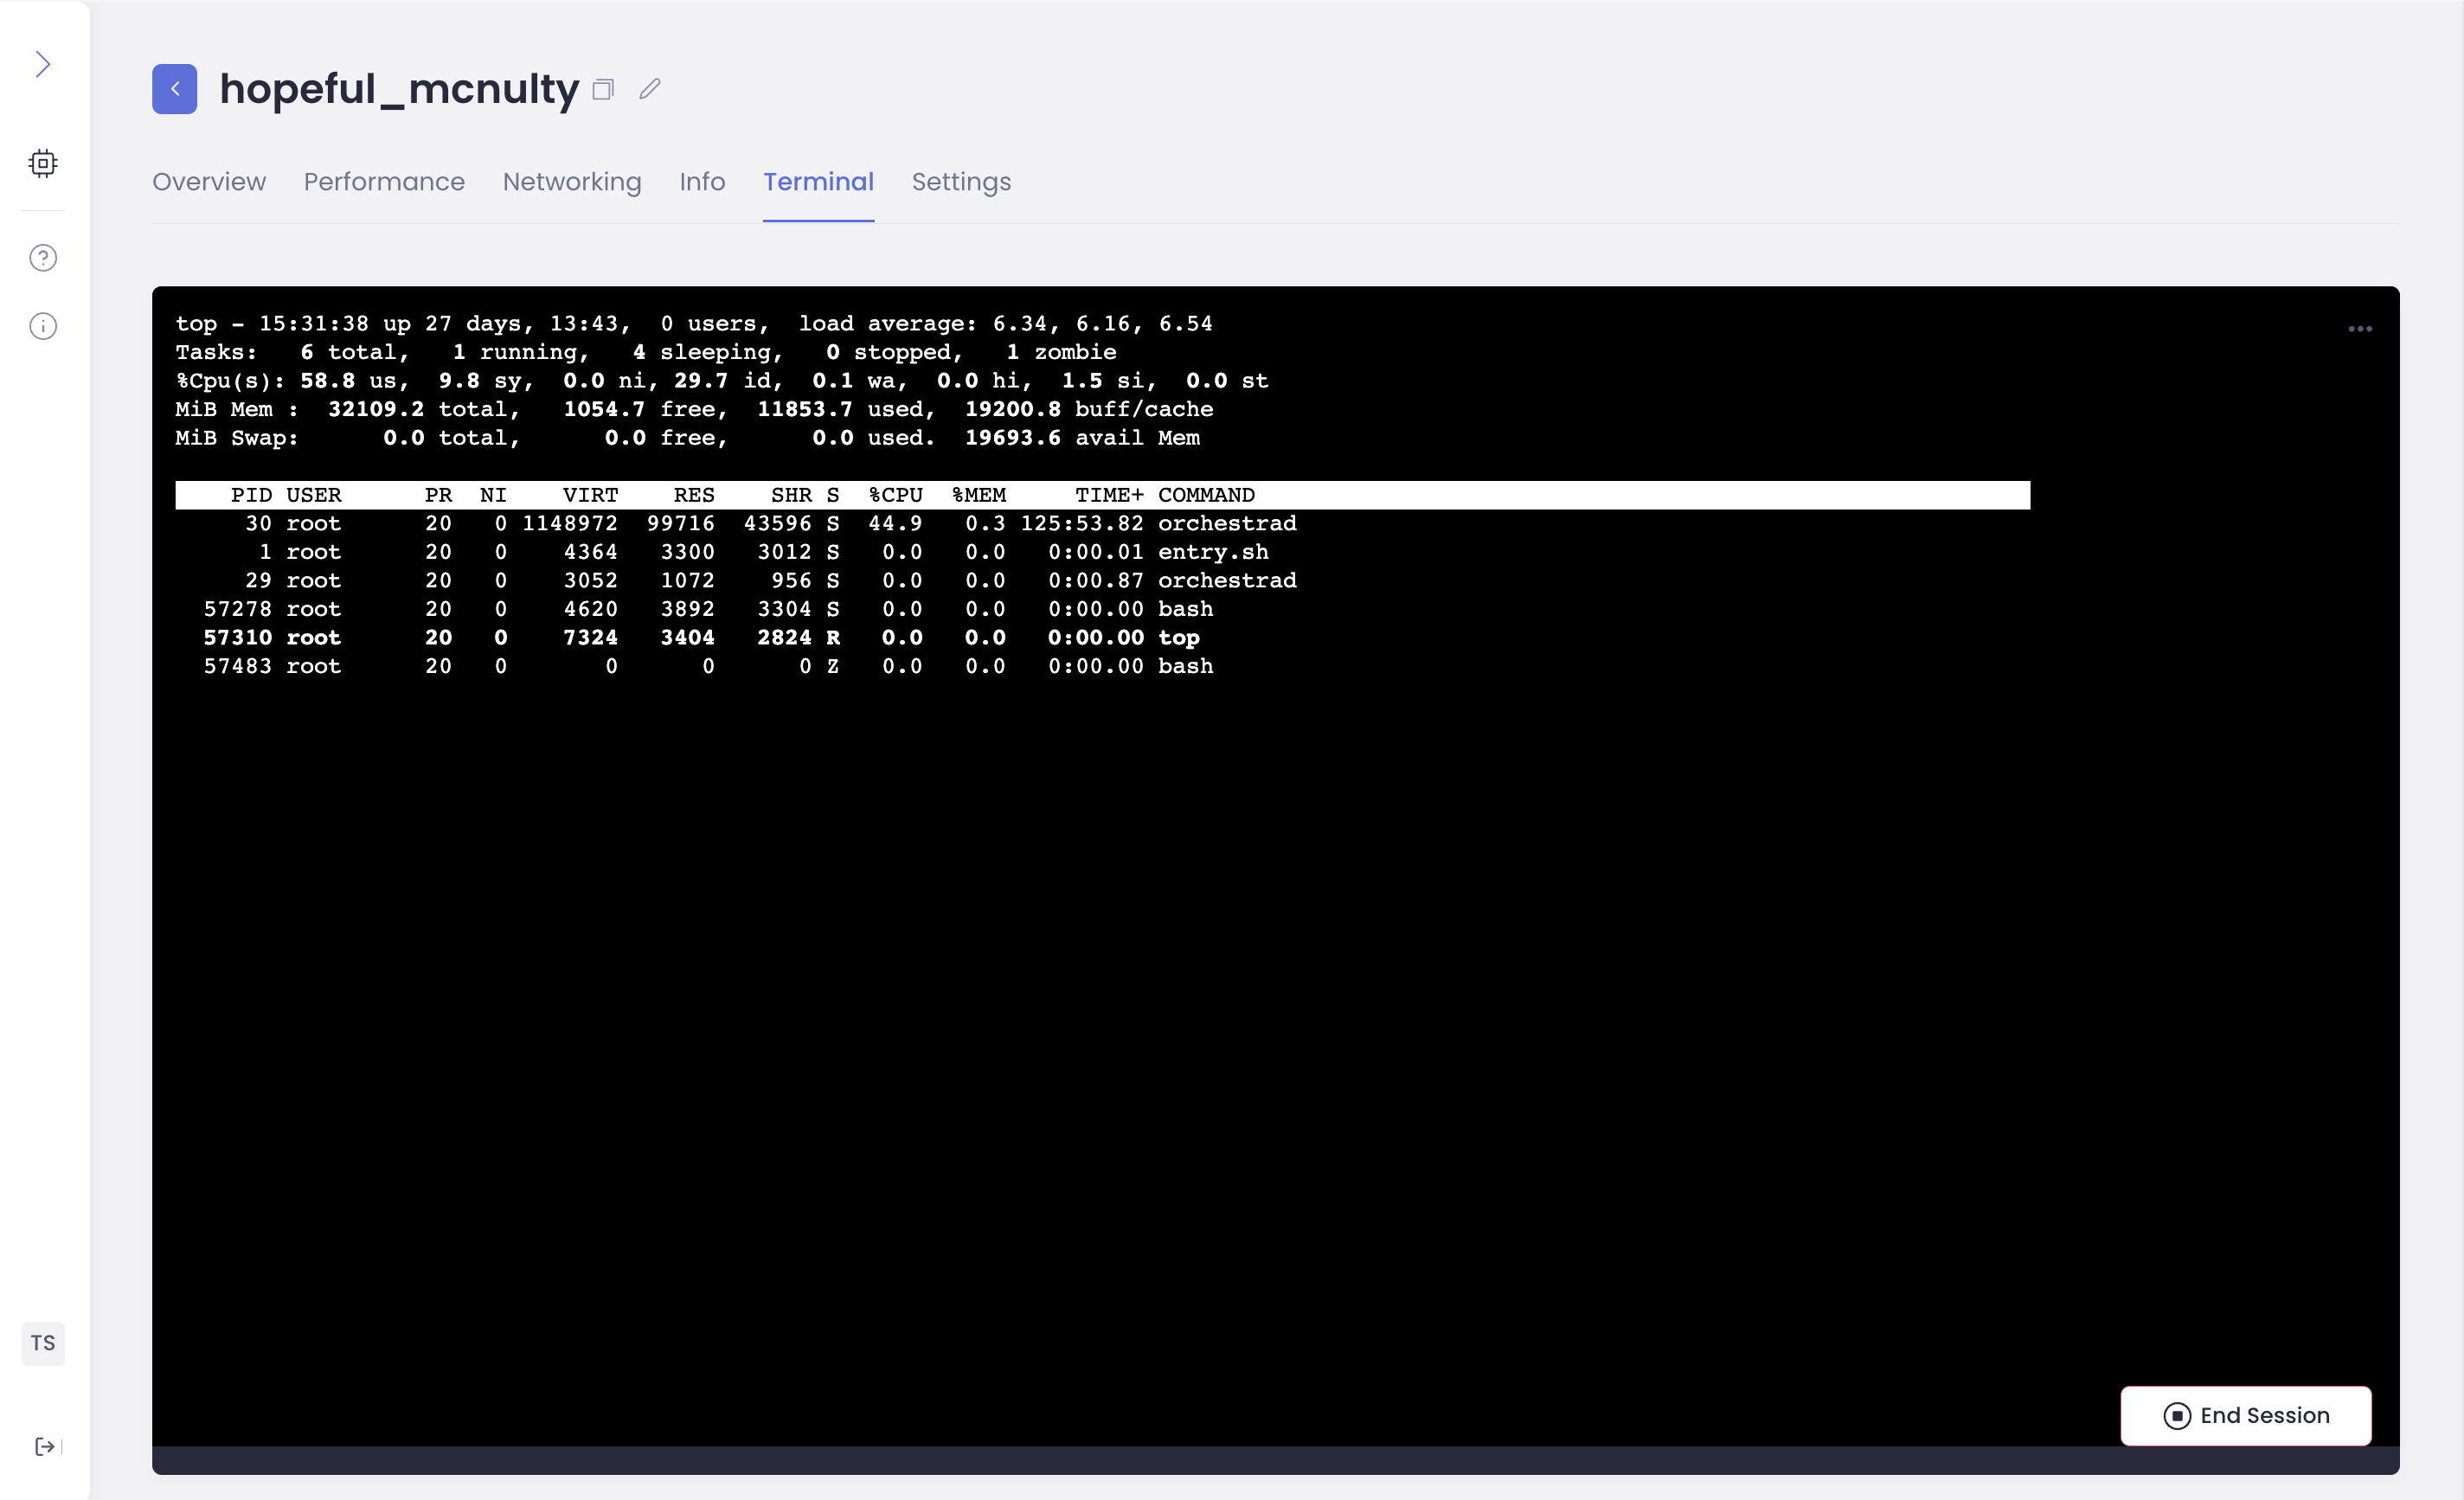
Terminal
The terminal tab contains the terminal that creates an instant SSH connection to the device.
Users can establish multiple connections with the same device.
Latency
Orchestra provides a low-latency terminal thanks to WebTransport technology. Whenever possible, Orchestra establishes a direct connection from the user’s browser to the device. If a direct connection is not feasible, Orchestra will transparently negotiate a proxy on behalf of the user.
SSH keys management
Orchestra and Identity Platform eliminate the requirement to manually handle SSH keys and introduce a role management system that simplifies the process of granting and revoking user access. When it comes to granting remote access to devices using traditional SSH methods, effectively managing SSH keys becomes essential. These SSH keys need to be securely documented, but unfortunately, there is no straightforward way to easily revoke access rights to the device once they have been granted.
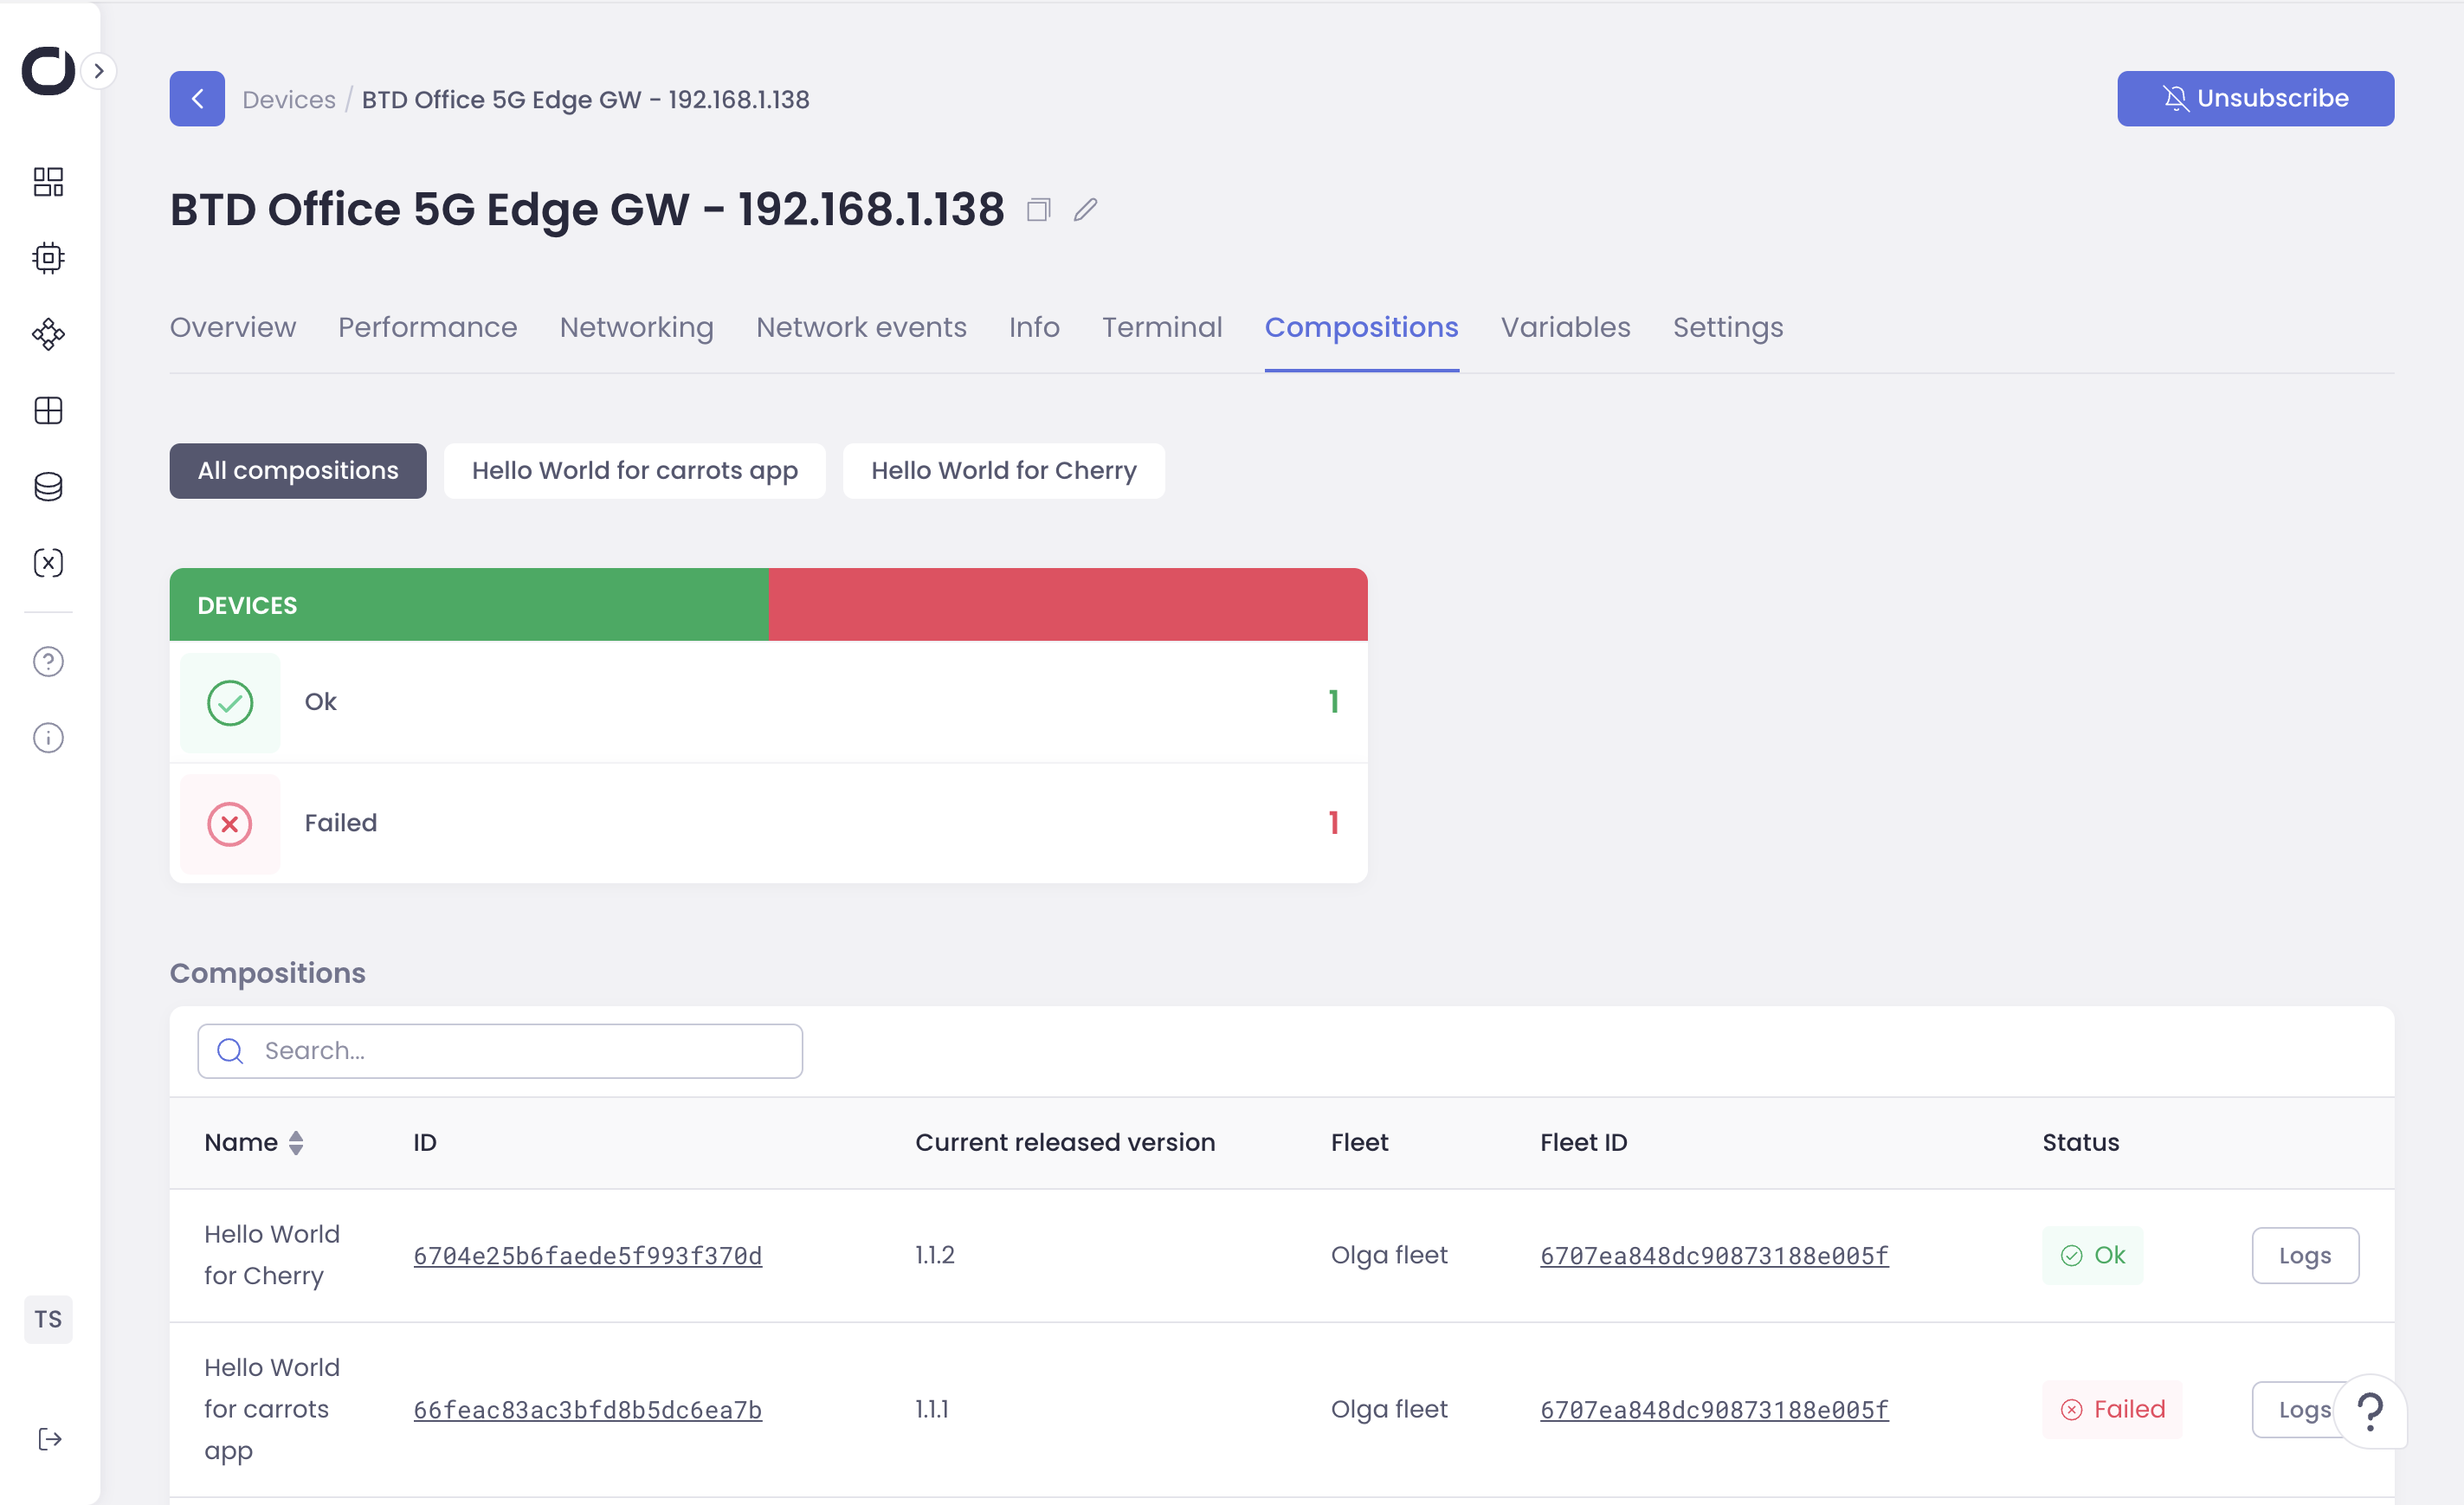
Compositions
The Compositions tab lists the containerized applications (compositions) deployed to this device. From this tab, you can:
View Deployed Compositions: See the name, version, and status of each composition.
(See Containerized Application Lifecycle Management for details on CALM).
Variables
The Variables tab allows you to manage device variables, which are key-value pairs that can be used to configure compositions and customize device behavior. Variables provide a flexible way to adapt deployments to different environments and scenarios. From this tab, you can:
View Existing Variables: See the name, value, and description of each defined variable.
Create New Variables: Define new variables with specific names, values, and optional descriptions. These can be used by your compositions to configure their behavior.
Modify Existing Variables: Edit the values of existing variables. This allows you to dynamically adjust settings without redeploying compositions.
Delete Variables: Remove variables that are no longer needed.
Note
Variables are scoped to the device. Changes made here only affect this specific device.
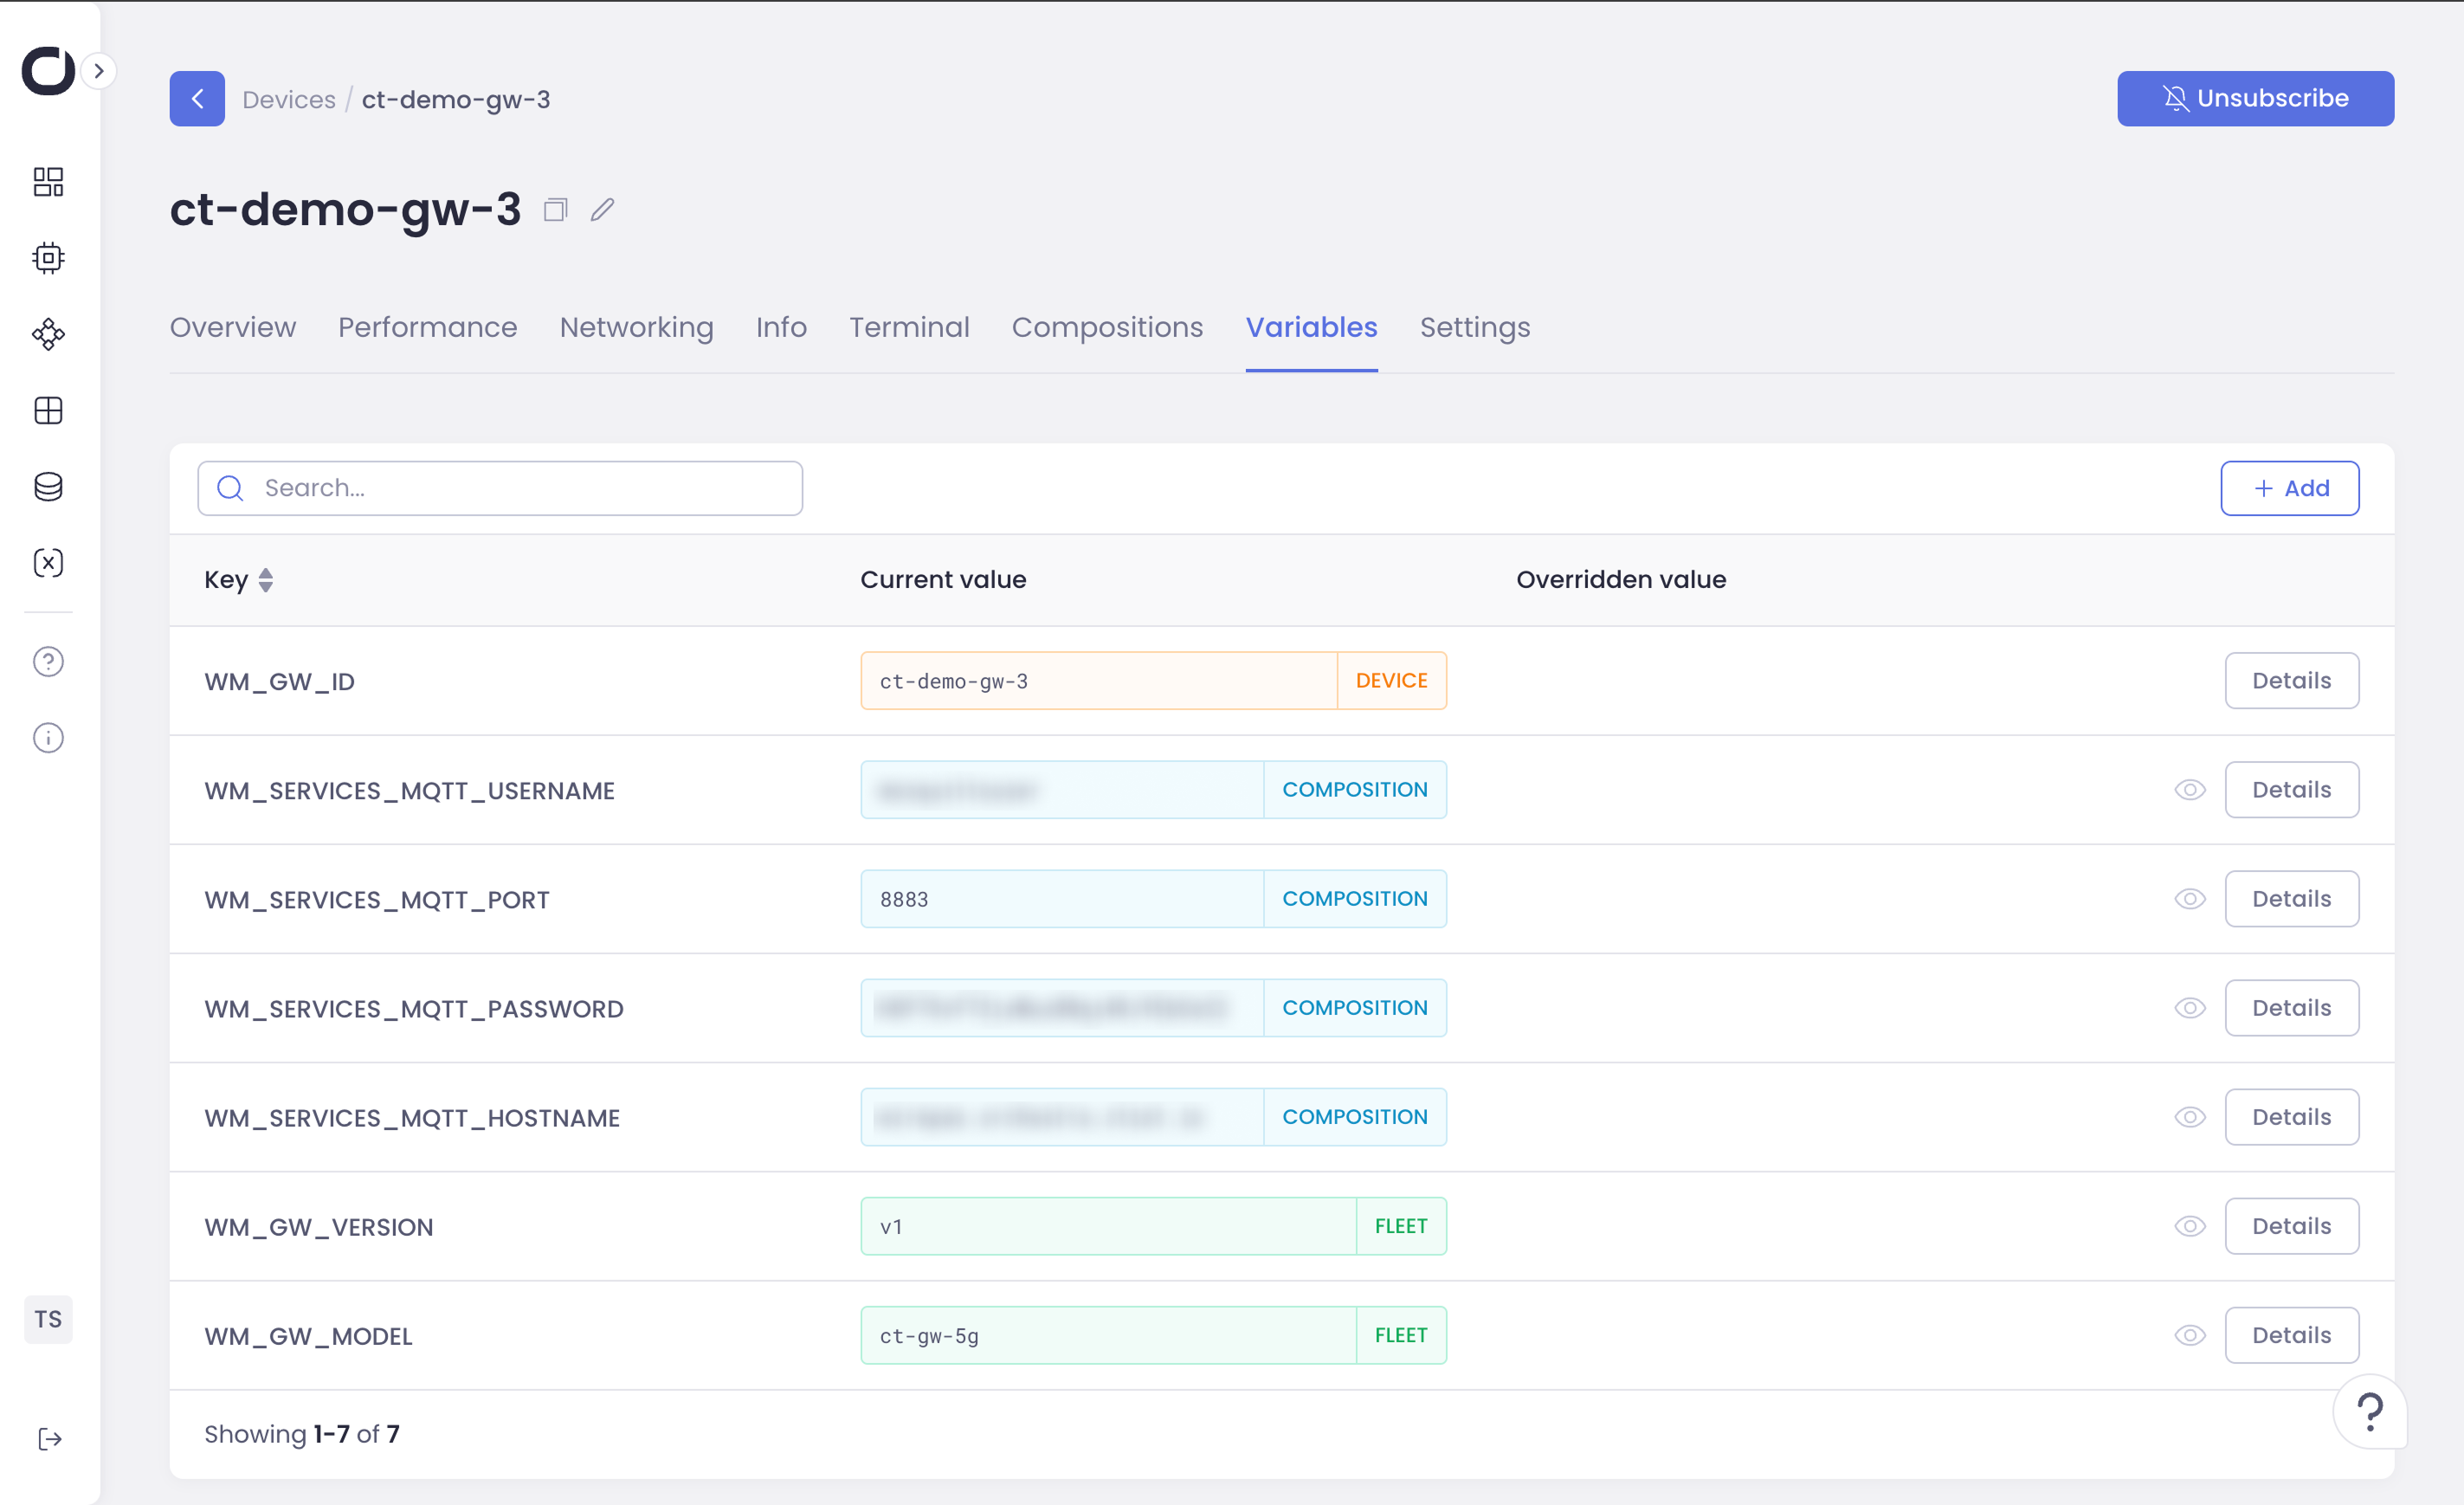
For more information on using variables within your compositions, see the CALM documentation (Containerized Application Lifecycle Management).
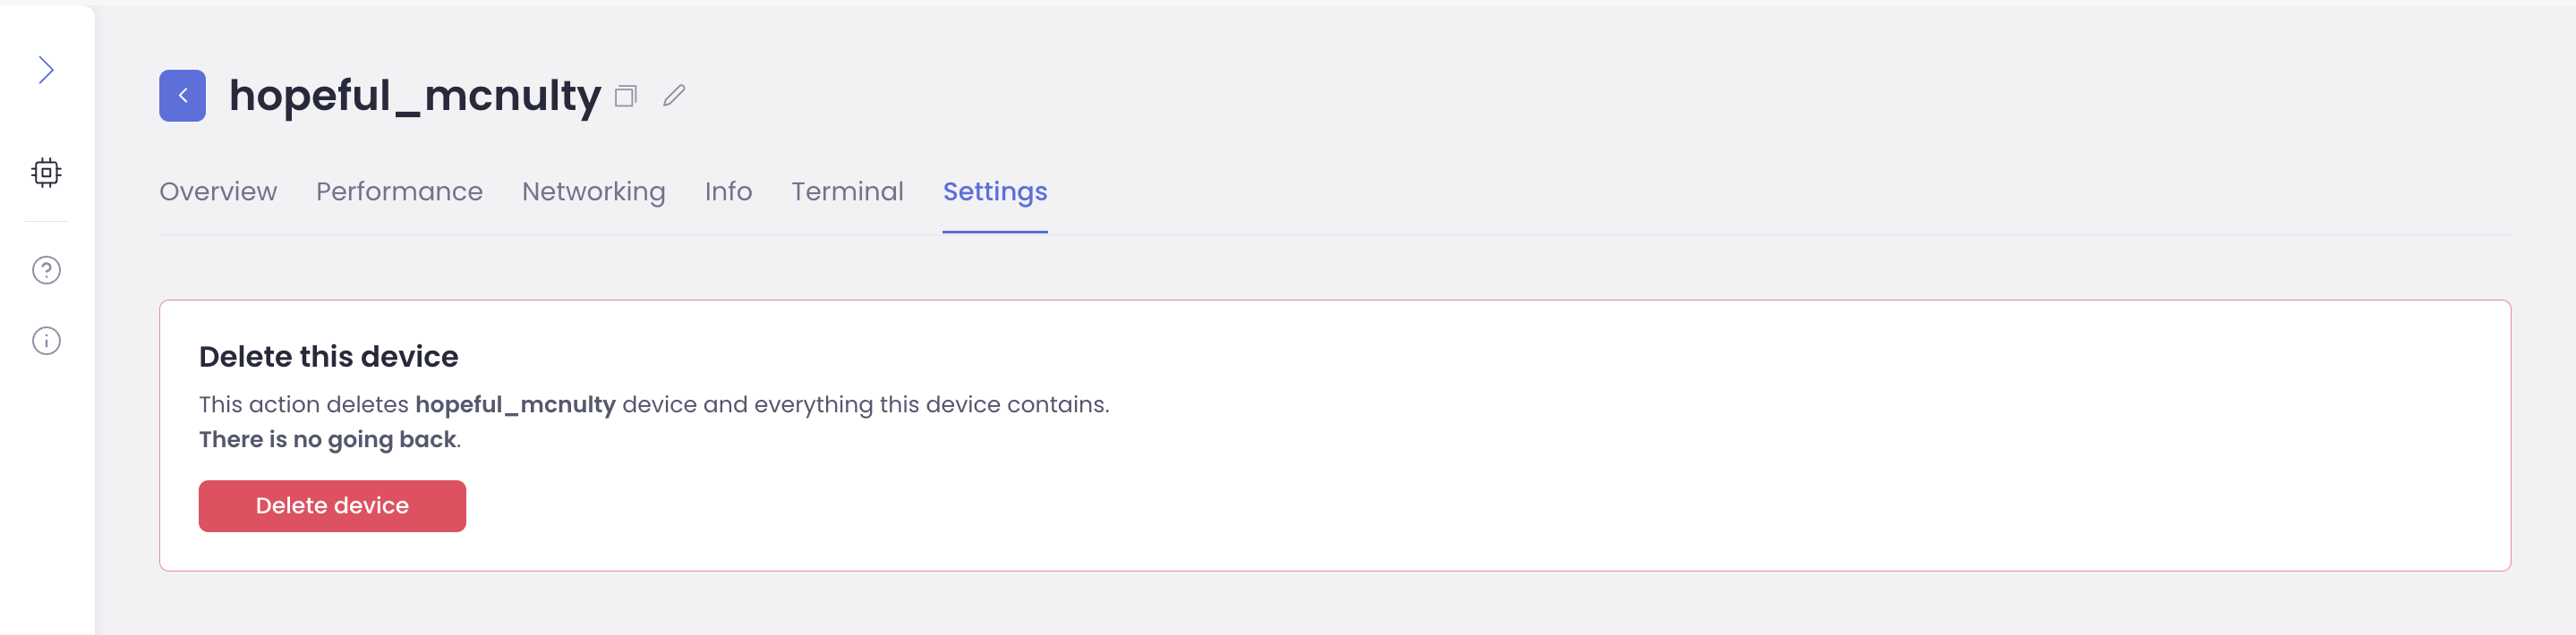
Settings
The setting tab offers the ability to remove the device from Orchestra.
How does metrics collection work
Orchestra’s data and metrics collection process is a systematic and efficient approach designed to gather comprehensive insights into the performance of interconnected devices. The Orchestra Daemon, residing on each Orchestra-enabled device, acts as the primary controller. This daemon periodically collects a diverse set of performance metrics, including CPU utilization, RAM utilization, network packets (both incoming and outgoing), disk I/O, and information about networking interfaces and their states. These metrics are then securely transmitted to the Orchestra Communications transport layer, a reliable and scalable mechanism that ingests, stores, indexes, and retrieves the data in the cloud. Leveraging Google’s Remote Procedure Call (gRPC) framework over the HTTP/2 protocol, the collected metrics are efficiently compressed using Protocol Buffers (protobuf). The entire communication process is encrypted and mutually authenticated using mTLS, ensuring the confidentiality and integrity of the transmitted data. Orchestra’s roadmap also includes the implementation of HTTP/3 (QUIC) communication for further improvements in efficiency. In the future, CTHINGS.CO plans to apply Machine Learning (ML) models to process vast amounts of unstructured data, enabling the early identification of potential issues that might otherwise go unnoticed. This proactive approach to data collection and analysis forms a crucial foundation for maintaining the reliability and optimal performance of interconnected systems in the dynamic landscape of the Internet of Things (IoT).